

| Download this report in PDF format |
The role of the Tear Film and Ocular Surface Society (TFOS) Dry Eye Workshop (DEWS) II Diagnostic Methodology Subcommittee was 1) to identify tests used to diagnose and monitor dry eye disease (DED), 2) to identify those most appropriate to fulfil the definition of DED and its sub-classifications, 3) to propose the most appropriate order and technique to conduct these tests in a clinical setting, and 4) to provide a differential diagnosis for DED and distinguish conditions where DED is a comorbidity. Prior to diagnosis, it is important to exclude conditions that can mimic DED with the aid of triaging questions. Symptom screening with the DEQ-5 or OSDI confirms that a patient might have DED and triggers the conduct of diagnostic tests of (ideally non-invasive) breakup time, osmolarity and ocular surface staining with fluorescein and lissamine green (observing the cornea, conjunctiva and eyelid margin). Meibomian gland dysfunction, lipid thickness/dynamics and tear volume assessment and their severity allow sub-classification of DED (as predominantly evaporative or aqueous deficient) which informs the management of DED. Videos of these diagnostic and sub-classification techniques are available on the TFOS website. It is envisaged that the identification of the key tests to diagnose and monitor DED and its sub-classifications will inform future epidemiological studies and management clinical trials, improving comparability, and enabling identification of the sub-classification of DED in which different management strategies are most efficacious.
Keywords: Diagnosis; Monitoring; Dry eye disease (DED); Dry Eye Workshop; DEWS; Methodology; Questionnaires; Tests for dry eye; Sub-classification of dry eyeForming an accurate clinical diagnosis is the mathematical equivalent to the problem of classification, where a multidimensional input vector of observed clinical parameters is mapped onto a discrete set of output classes, using joint probabilities and history to inform a pattern recognition algorithm. Optimal segregation of the variable space is determined by a combination of risk factors and training data. In one dimension, this concept is represented by the familiar overlapping histograms shown in Fig. 1a. True positives (TP) and false positives (FP) are represented by the portion of the affecFig. 1
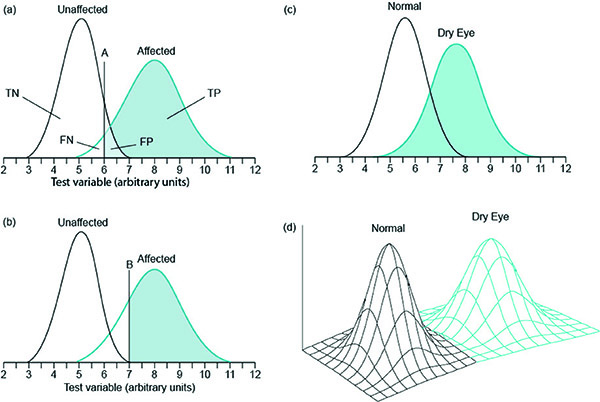
In Fig. 1b, the cut-off is set to achieve a higher specificity, as defined by the ratio of true negatives to the total number of unaffected subjects in the study. Accordingly, specificity = TN/(TN+FP).
In any one dimension, sensitivity and specificity are inversely related, meaning that a more sensitive cut-off will cause a higher rate of false positives, and a more specific cut-off will cause a higher rate of false negatives.
The level of risk of an incorrect diagnosis generally governs the optimal cut-off for an individual sign or symptom. While there are a variety of valid, statistical risk models that can be used to choose an optimal cut-off, for example, maximizing the ratio of true positives to false positives, receiver operator characteristic apex, etc, [5] clinical risk should supersede purely statistical methods when relying on a small number of signs or symptoms. For example, if a cataract surgeon understands the impact of an unhealthy ocular surface on biometry and visual outcomes [6–9], a more sensitive cut-off is preferable, as there is little to no safety hazard in treating a DED false positive with lubricants or other first line therapy. Conversely, the systemic costs of over-diagnosis must be considered in general practice, suggesting that a cut-off that produces equivalent risk of false positives and false negatives is more generally applicable for an individual marker. Equivalent risk results in a cut-off at the intersection between the affected and unaffected distributions if the measures of signs or symptoms are normally distributed.
No single “gold standard” sign or symptom that correlates perfectly with the DED state has been established. If one existed, the distributions of this theoretical marker would be very similar to Fig. 1a and b, with a very small overlap in the affected and unaffected curves. Instead, there is a significant overlap between normal and DED distributions of currently available metrics, as all signs and symptoms fluctuate over time and vary significantly within different levels of disease severity [10,11]. Actual histograms are far more similar to Fig. 1c than to the idealized tests of Fig. 1a & Fig. 1b [12,13].
The lack of a gold standard makes it very difficult to establish true referent histograms when evaluating new diagnostic tests. The traditional approach to DED classification requires DED subjects to satisfy all criteria within a series of sensitive thresholds (such as Ocular Surface Disease Index (OSDI) ≥ 13, Schirmer < 10 mm/5 min, TBUT < 10 s, positive staining) and normal controls to satisfy all criteria within another, non-overlapping set (such as: OSDI < 7, Schirmer ≥ 10 mm/5 min, TBUT ≥ 10 s, negative staining) [14]. While this approach can produce strikingly high sensitivities and specificities of the diagnostic methods under evaluation, as has been done for the recent introductions of both matrix metalloproteinase-9 (MMP-9) (85% sensitivity) [14], and tear osmolarity (87% sensitivity) [15], this approach excludes a large number of DED patients, as signs and symptoms are uncorrelated across the broad population and do not move in synchrony [16–22]. For instance, it is very common to encounter a patient with a high level of symptoms and yet a lack of evidence of staining. Similarly, patients can be asymptomatic but exhibit obstructed meibomian glands, short breakup time and high osmolarity [22]. Excluding these uncategorized individuals prevents randomization across the broad population and describes sampling bias. Gaps in the inclusion criteria lead to spectrum bias, where normal patients are compared to more severe patients, to the exclusion of the mild to moderate subjects that are difficult to categorize [14]. Both sampling and spectrum bias will improve the sensitivity and specificity of a particular study, but will also increase the mean of the affected sample, shift the intersection of the two histograms to produce an unreasonably high cut-off, and result in unexpectedly poor sensitivity in the broad population. This is particularly relevant to regulatory trials, where labelled performance may not be replicated in the field, if tested on populations that are different to those included in the trial. For example, in the 510(k) summary of a new MMP-9 test, one site reported 97% sensitivity in diagnosing mild DED subjects at ≥ 40 ng/mL, while the other three sites reported 66%, 67% and 76% sensitivity (https://www.accessdata.fda.gov/cdrh_docs/pdf13/K132066.pdf). In milder populations that did not apply the regulatory trial inclusion criteria, the 40 ng/mL cut-off demonstrated an 11% sensitivity [23]. Similarly, using an equivalent risk threshold of ≥312 mOsm/L applied to a broad population segregated by uncorrelated clinical signs, tear osmolarity reported a sensitivity of 73% [13], and 67% in a milder population outside the trial setting [23].
As a counterpoint in evaluating new diagnostic metrics, it is not clear whether spectrum bias is undesirable when there is no reliable gold standard to definitively diagnose DED. Without a competent benchmark for delineating affected and unaffected populations, histograms of subject populations will significantly broaden and overlap due to misclassification [11], leading to artificially low sensitivity and specificity of the new diagnostic metric under test. Because symptoms and classical DED signs are so variable over clinically relevant timescales [10,24], inclusion criteria that rely upon these metrics will result in a heterogeneous bias, impossible for even an ideal diagnostic metric to achieve good trial performance. When compared to uncorrelated inclusion criteria across the broad population, novel test sensitivities in the 40–70% range are statistically pre-determined for a single metric, regardless of how informative a test is for monitoring therapeutic efficacy or explaining mechanism of action. A good example of how subject misclassification can affect the evaluation of diagnostic metrics can be seen in Huang et al., 2012, which assessed interleukin (IL)-8 and IL-1 receptor agonist (IL-1Ra) as DED biomarkers [25]. In that study, the prospective criteria fully partitioned patients from controls in many DED measures (controls OSDI < 13, corneal staining = 0; DE1 OSDI ≥ 13, corneal staining < 4; DE2 OSDI ≥ 13, corneal staining = 4–7; and DE3 OSDI ≥ 13 and corneal staining >7), but resulted in sizeable overlap of IL-8 (inflammatory) and IL-1Ra (anti-inflammatory) levels between the tears of normal subjects and mild to moderate DED subjects. Conversely, a post-hoc partitioning of the patient space excluded the patients that are difficult to categorize with symptoms between OSDI 13–19 (OSDI < 13, corneal staining = 0, TBUT > 7; DE1 OSDI ≥ 20, corneal staining < 4 and TBUT ≤ 7; DE2 OSDI ≥ 20 corneal staining = 4–7, TBUT ≤ 7; and DE3 OSDI ≥ 20, corneal staining > 7, TBUT ≤ 7) that resulted in clear, significant differences between the subset of controls and mild subjects [25]. The true performance of a diagnostic metric is therefore somewhere in between the superlative performance in trials with spectrum bias and the compromised performance in trials across a broad population, using symptoms and traditional signs as inclusion criteria.
Selection bias occurs when efficacy of metrics that were used in the selection and differentiation of subjects are directly compared to a novel test that was not used as part of the inclusion criteria [26]. As clinical signs and symptoms are generally uncorrelated in DED, novel tests evaluated in this manner will necessarily fail. Many biomarkers (such as MMP-9, tear osmolarity, IL-1Ra, IL-8, interferon gamma-induced protein (IP)-10, S100 calcium binding protein A9) provide novel insight into disease pathogenesis [25,27–29], but because this information is unavailable from clinical observation, comparing performance of novel diagnostic metrics against the traditional signs such as staining, TBUT and symptoms will result in an apparently poor performance. This creates a paradox where, if a novel test is correlated to older metrics, it will have strong performance in a clinical trial – but there would be no need to measure the new information. Selection bias can also occur when a novel test is compared in subjects defined as having a history of DED, as these are usually based on established diagnostic tests, which the novel test is then compared to. Furthermore, trials that evaluate new markers must also prospectively align the time-courses of therapy or washout subjects, as different markers respond at different rates. Failure to account for therapeutic timing is also a type of selection bias that artificially rewards lagging indicators if leading indicators have already responded [30].
In order for a new diagnostic metric to be most useful for monitoring, the marker should a) play a direct role in the pathogenesis of the disease, b) significantly improve upon treatment with an effective therapy, with the best markers traversing a large dynamic range and c) be specific to DED. Given the inherent temporal variation in all DED signs and symptoms, knowing whether a therapy has in fact altered the distribution of a sign or symptom at a single visit is non-trivial, especially with a single additional observation on follow up.
The term Minimal Clinically Important Difference was first described by Jaeschke and colleagues in 1989 as “the smallest difference in score in the domain of interest which patients perceive as beneficial and which would mandate, in the absence of troublesome side effects and excessive cost, a change in the patient's management” [31]. Some changes are found to be statistically significant, but of a magnitude too small to be noticed by a patient or to influence clinical management decisions. While clinically important differences are subjective, possibly changing with circumstances and time, they inform sample size calculations. In the field of DED research, only the Impact of Dry Eye on Everyday Living (IDEEL) – Symptom Bother scale [32] and OSDI [24] questionnaires have been assessed to determine a clinically important difference (12 and 7.0–9.9 points, respectively). The differences required in clinical studies for signs and symptoms of DED, and the resulting sample sizes needed for clinical studies using these metrics to determine a significance difference, are described in Table 1.
Another statistical approach, in the form of the reference change value (RCV), provides a confidence interval that new observations are not simply within the statistical error of the original distribution. To calculate RCV, the percentage analytical variation of a method as measured on traceable control materials (denoted CVA; or for clinical observations CVA would be intra-observer variation) and the percentage intra-individual (within-subject) variation (denoted CVI) within a population are needed.
The Z-score for a one-sided, 95% probability that the change in sign or symptom is “very likely real” is 1.65 [48,49]. In applying an RCV, the CVI is typically derived from the literature [48]. Since most DED metrics do not have published data with thousands of subjects from which to draw reliable CVI data (unlike clinical chemistry studies for example), it is recommended that one should subtract the CVA from the CVI before calculating the RCV if the two CV measures are derived from the same study, so as to avoid double-counting. If the change in a sign or symptom between visits exceeds the calculated RCV, there is a high probability that the therapy is working. Very few papers have endeavoured to estimate the RCV of different tests for DED. Fortes et al., estimated the RCV for tear osmolarity to be 13 mOsm/L [49], although they did not correct the CVI for the CVA in the same study. The Fortes estimate would require a patient with a 338 mOsm/L reading upon initial visit to measure 325 mOsm/L or below for a clinician to believe a therapy was very likely having an effect. A corrected CVI would result in an RCV of about 10 mOsm/L. The authors are not aware of any peer-reviewed studies that reported an RCV for common clinical DED tests, but applying published longitudinal data [10], the CVI can be derived from the average and standard deviation of the subjects (n = 52), applying a zero CVA for convenience. RCVs for TBUT = 6.3 s (average over 3 months = 4.8 ± 2.7 s), 9.6/15 for Oxford corneal fluorescein staining (2.9 ± 4.1), 14.2/27 for Foulks/Bron meibomian gland grading (11.0 ± 6.1), and 55.3/100 for OSDI (34.7 ± 23.7) [10]. Like other statistical tests, the RCV should be used only as a guide and not an absolute value – the clinician still needs to take into account all available information when making a determination about therapeutic efficacy. Comparing the statistically derived RCVs to the published minimal clinically important difference suggests that the actual value is somewhere between these two approaches, less than the RCV and greater than the minimal clinically important difference.
In order to increase sensitivity and specificity simultaneously, it is necessary to expand a diagnostic input vector to include multiple dimensions. As shown in Fig. 1d, extra observations eventually allow a clear segregation of the affected and unaffected populations at higher orders, even if there is significant overlap in lower dimensions. For example, if one wanted to classify trees based on leaf colour alone, it would be a very noisy, imprecise way to separate elm trees from oak trees. If you add in leaf shape, tree height, sap characteristics, bark texture and so forth, the task becomes more straightforward. Sensitivity is optimized in parallel testing by diagnosing disease if any one of a series of highly specific signs is measured to be abnormal [50]. Also known as a logical “OR” operator in computing, parallel sensitivity is calculated by subtracting the product of the two individual sensitivities from their sum (Sensitivity A + Sensitivity B – (Sensitivity A x Sensitivity B)), while parallel specificity is simply the product of the individual test specificities (Specificity A x Specificity B). Each additional metric will increase sensitivity, while multiplicatively reducing specificity. Low specificity tests quickly degrade the combined specificity. Three parallel tests at 50% sensitivity and 97% specificity achieve 87.5% sensitivity and 91.3% specificity, which is far better than any one individual test. However, if the three tests had only 90% specificity, the parallel specificity would degrade to 72.9%. Therefore, when adding markers in parallel, more specific diagnostic metrics allow for greater confidence – which is somewhat paradoxical, as most clinicians judge new diagnostic metrics based on their sensitivity, not their specificity. As an example, parallel testing of multiple tear proteins has been shown to be very effective in diagnosing DED, despite each protein marker being individually quite insensitive (≈40–60% sensitive); when used in parallel as part of a panel, the combined measurements produce greater than 90% combined sensitivity and specificity [27,50,51].
As even non-invasive tests of DED require alternation of blinking or bright illumination, the sequence of testing can affect the results. It is recommended that the tests are performed from the least to the most invasive [52].
This section reviews the development and enhancement of diagnostic metrics of DED, particularly since the previous TFOS DEWS report. The order in which the tests are reviewed is not a reflection of their importance, nor their invasiveness. Due to the issues highlighted in Section 5 with regard to comparing the sensitivity and specificity of tests, recommendations are based on the level of evidence combined with the invasiveness of the test and its ability to be conducted in a standard clinical setting, ideally without highly specialist instrumentation. The recommended diagnostic ‘homeostatic marker’ tests are the minimum data set to be collected from all patients identified by the screening questionnaire (as many patients do not elicit symptoms unless specifically asked) and in all DED clinical trials. However, additional DED metrics should be applied to identify the subtype of DED and the specific aspects (such as inflammatory markers or environmental triggers) relevant to a clinical trial.
As in the previous TFOS DEWS definition of DED [53], the current TFOS DEWS II definition for DED describes the presence of ocular surface symptoms and other signs of DED [4]. Although the relationship between symptoms and signs of DED is not linear and varies across individuals and types of DED [54], the ability to accurately quantify ocular surface symptoms is an important screening tool that can assist in establishing the medical necessity for additional DED evaluation. It is also critical for monitoring the progression of the condition and response to treatments. In this regard, symptom measurements are very similar to clinical signs of DED. It is therefore recommended that a validated symptom questionnaire be administered at the beginning of the patient interaction.
In the clinical setting, symptoms or other subjective reports are typically captured through the patient case history [55,56]. Symptoms reported during non-scripted verbal interviews are very difficult to standardize and quantify. To enhance standardization in clinical research, symptoms are typically gathered through the use of questionnaire instruments that are most often self-administered by the patient or research subject without input from the clinician or researcher. In DED, these instruments either measure ocular surface discomfort or vision symptoms associated with DED, the impact of DED on everyday function, or health-related quality of life. Table 2 gives a summary of the most frequently used DED questionnaires, their original and recent citations, and the forms of validation supported by the literature cited.
For questionnaires that are additionally intended as outcome measures for registration studies at the US Food and Drug Administration (FDA), an FDA guidance document describes a path for the development of a Patient Reported Outcome (PRO) [84]. For most DED research and clinical care, the majority of symptom tools focus primarily on the measurement of symptoms associated with DED, and these instruments, while valid, do not follow the full psychometric development plan for PROs. However, even for symptom questionnaires that are not supporting claims, it is critical that they be validated for their discriminative ability. It should also be noted that validation is generally using patient groups with Sjogren Syndrome versus non-Sjogren Syndrome ADDE and/or healthy controls, with little focus on EDE. A recent thorough review by Guillemin and co-workers in 2012 covers the topic of questionnaire validation, and strengths and weaknesses of many DED questionnaires [85].
It is helpful if instruments are also shown to be reproducible and responsive to change in the DED condition. For clinicians, it can be helpful to have published diagnostic score criteria to screen patients who may need further testing. Table 2 covers these aspects of the DED instruments currently in use. Several of these questionnaires are undergoing translation for use in other populations [65,67]. New DED questionnaires are undoubtedly in development, and they can all be assessed for the features cited here.
In general, the OSDI is the most widely used questionnaire for DED clinical trials. The OSDI measures frequency of symptoms, environmental triggers and vision related quality of life. Many other questionnaires have established concurrent validity against the OSDI in recent publications. The consensus view of the committee was to use the OSDI due to its strong establishment in the field or the DEQ-5 due to its short length and discriminative ability [37]. The continuous nature of visual analogue scales is attractive for clinical trials compared to discrete Likert-based question rating, so questionnaires such as the severity scale of the Symptoms Analysis in Dry Eye (SANDE) should be considered for repeated comfort assessment.
A number of patient-reported outcome questionnaires have been developed which have items or subscales that assess patients' visual experiences of DED. These include:
The OSDI includes 6 questions related to visual disturbance (blurred vision, or poor vision) or visual function (problems reading, driving at night, working on a computer, or watching TV). A study showed that the DED group of 87 patients had worse OSDI composite and subscale scores for vision-related function, compared to a group of 71 patients without DED [86].
The DEQ has 4 questions related to visual disturbance, including the frequency of visual changes, how noticeable the visual disturbance is in the morning and at night, as well as how much the visual fluctuation bothers the respondent. Visual symptoms generally increase in intensity over the day, suggesting that open-eye conditions might affect symptom progression [58]. One study using the DEQ found that 10% of patients with non-Sjögren syndrome DED and 30% of patients with Sjögren syndrome complained of impaired vision while others reported that between 42% and 80% of patients with primary Sjögren syndrome experienced “disturbances in daily vision” [18,87,88].
The IDEEL questionnaire has 2 items related to visual disturbance including the extent to which a person is bothered by “blurry vision” or “sensitivity to light, glare, and/or wind”. Statistically significant differences in responses to the IDEEL questionnaire scores across varying levels of DED severity have been observed [89].
The National Eye Institute’s Visual Function Questionnaire (NEI VFQ-25) is a generic visual function questionnaire with seven visual domains including general vision, distance vision, peripheral vision, driving, near vision, color vision, and ocular pain. DED patients have poorer NEI VFQ-25 scores for the subscales of general health, general vision, ocular pain, short distance vision activities, long distance vision activities, vision-related social function, vision-related mental health, vision-related role difficulties, vision-related dependency, and driving [86,90].
The Dry Eye-Related Quality-of-Life Score (DEQS) questionnaire developed in Japan has shown strong correlations with 4 subscales (Ocular Pain, Near Vision, Distance Vision, and Mental Health) of the NEI VFQ-25 [62].
The Computer-Vision Symptom Scale (CVSS17) is a Rasch-based linear-scale that contains 17 items exploring 15 different symptoms of computer-related visual and ocular symptoms. The CVSS17 includes a broad range of symptoms such as photophobia (items A33 and C23) and “blinking a lot” (item A20), and has been reported to be valuable in the evaluation of computer-related visual and ocular symptoms [91].
Conventional distance and near visual acuity testing, employing Early Treatment Diabetic Retinopathy Study (ETDRS) and Lighthouse near vision charts, showed significant deterioration in symptomatic and asymptomatic OSD subjects, which improved temporarily with instillation of artificial tear drops [92,93]. Similar static tests that require reporting the orientation of sine wave gratings of varying contrast have also been utilised pre- and post-artificial tear instillation [94,95]. Dynamic methodologies to assess visual function in DED patients include detection of randomly located targets of differing contrast during a driving simulation [96]. Ridder et al. employed computer-generated sine-wave gratings that were presented briefly (16 msec duration), and demonstrated that DED patients exhibit a decrease in contrast sensitivity with tear film breakup [97].
Functional visual acuity (FVA) was first defined by Goto and colleagues, as functional vision for daily activities [98]. It corresponded to the visual acuity measured with the patient's habitual prescription, during 10–20 s of sustained eye opening without blinking, aided by anesthesia. To better standardize the test, a commercialized system was developed by Ishida and colleagues, with Landolt optotypes presented in one of four orientations; an increasing optotyope size is presented when a previous presentation is incorrectly identified or when there is no response within the set display time (selectable from 1 to 5 s); a decreasing size is presented when the answer is correct (SSC-350; Nidek, Gamagori, Japan) [99]. The visual maintenance ratio is the average FVA divided by the baseline visual acuity. FVA is reduced in DED patients, Sjögren syndrome and Stevens Johnson syndrome, more than in controls, due to irregularity of the ocular surface and induced higher order aberrations (HOAs), and it improves with treatment [98–101]. The application of FVA measurements in ocular surface disease (OSD) has identified a significant decline of FVA relating to decreased tear clearance in the elderly and associated with the short BUT type of DED in office workers, atopic keratoconjunctivitis, conjunctivochalasis and in elderly drivers [102–106].
Initial work examined the optical and visual impact of tear breakup during periods of non-blinking by quantifying vessel contrast in the fundus images and by monitoring the psychophysical contrast sensitivity and the spatial distribution of tear thickness changes by retroillumination [107,108]. Advances in wavefront aberrometers has enabled assessment of real-time changes in the ocular optics by evaluating refractive anomalies at multiple sites over time. Laser in situ keratomileusis (LASIK)-related dry eyes had greater optical aberrations due to increased tear film irregularity, compared to healthy controls [109]. Serial measurements of higher order and double pass (objective scatter) aberrations after blinking in patients with DED is associated with increased HOAs resulting, in part, from superficial punctate keratitis (SPK) overlying the optical zone [110–112].
Scheimpflug imaging has been used to show that the ocular forward light scattering and corneal backward light scattering from the anterior cornea are greater in dry eyes than in normal eyes and that increased corneal backward light scattering in dry eyes, at least partially, again resulted from central SPK overlying the optical zone [113].
Visual disturbance is currently assessed subjectively through ocular symptomology questionnaires. Until well-established objective clinical measures of visual disturbance become widely available, there is no specific additional vision test that can be recommended by TFOS DEWS II for the diagnosis of DED. This does not preclude vision tools, that are currently under development, being used to enhance understanding of individual cases of dry eye.
The Definition and Classification subcommittee of TFOS DEWS II have included “tear film instability” in their revised definition of DED [4]. Impaired tear film stability has been one of the fundamental diagnostic criteria for diagnosing abnormality of the tear film and many ways of evaluating tear film stability have been described [114].
In clinical practice, the most frequently employed test of tear film stability is the measurement of the tear film breakup time (TBUT); this is the interval of time that elapses between a complete blink and the appearance of the first break in the tear film [115,116].
Sodium fluorescein may be instilled to enhance visibility of the tear film, when the test is referred to as the fluorescein breakup time (FBUT); however, fluorescein reduces the stability of the tear film and therefore the measurement may not be an accurate reflection of its status [117,118]. The fluorescein can be instilled in varying volumes and concentrations using either a micropipette, or more commonly impregnated strips [66]. Since controlling the volume instilled with strips may be difficult, the use of narrow (1 mm) strips and dry sterile applicators have been proposed [118–121]. A standardized methodology is also important and instructions are generally given to blink naturally three times and then to cease blinking until instructed [66]. The reference value for DED diagnosis when fluorescein is used ranges from a cut-off time of less than 10 s [122], to less than 5 s when smaller, more controlled volumes of fluorescein are used [123,124]. The sensitivity and specificity of the test have been reported to be 72.2% and 61.6%, respectively, in individuals with Sjögren Syndrome [88]; however, mild and moderate DED patients have a broad range of FBUT values and the diagnostic value is less certain for these DED sufferers [13,125]. A significant downfall of the measurement of FBUT is its dependence on subjective assessment by the observer and attempts have consequently been made to automate the measurement [126,127]. Despite the drawbacks of using fluorescein to assess tear film stability, FBUT still remains one of the most commonly used diagnostic tests for DED in clinical practice [128–132].
Since tear film stability can be affected by fluorescein, temperature, humidity and air circulation, non-invasive breakup time (NIBUT) measurements have become more popular in both clinical practice and research. Many of these techniques involve the observation of the specular reflection of an illuminated grid pattern from the tear film [133], and these typically result in longer measured values of time to breakup than stability assessment techniques involving fluorescein instillation [118,134,135]. NIBUT can also be measured through observations of placido disk images that are reflected from the anterior ocular surface with many of the currently marketed corneal topography systems [136], and specific software has been developed to assess localized changes in corneal power, as an indication of surface irregularities and breakup of the tear film, with some instruments [137–140]. Automated assessment of tear film stability is also possible with specific software on instruments such as the Keratograph (Oculus, Wetzlar, Germany), which detects and maps locations of tear breakup over time [141,142], The NIBUT recorded with automated systems was initially reported to be shorter than other subjective measurements of NIBUT, and even conventional FBUT measurements [140–142], however, a recent study described the reverse finding [143]. A standardized methodology is also important when conducting NIBUT measurements with similar instructions to blink naturally three times and then to cease blinking until instructed to blink again [66].
A different approach has been used by other groups of researchers in which high-speed videokeratoscopy is used to estimate the variance of the number of rings detected radially from the centre of the videokeratoscopic image [144–146]. The changes in this variance indicate the instability in image quality, which is directly related to the quality of the tear film, and this has been used as an estimate of the NIBUT. This technique has been further refined by Downie using the E300 corneal topographer (Medmont International Pty Ltd., Victoria, Australia) to measure Tear Film Surface Quality Break-up Time [147]. The algorithm used identifies and eliminates images with excessive movement and is able to recognize shadows arising from eyelashes.
Interferometry is also used to assess the stability of the tear film in a non-invasive manner [148]. Using this technique, the time between the blink and the first appearance of a discontinuity in the lipid layer can be measured, and instruments have been developed specifically for this purpose [38,149–152]. More recently an instrument employing interferometry has been developed, for clinical use, to measure the thickness of the lipid layer (TearScience® LipiView®, TearScience, Morrisville, NC) [77,153]; however, this cannot be used to measure the tear breakup time since only the tear film over the lower half of the cornea is analyzed and the area of initial break could occur anywhere across the cornea, and is noted frequently at the upper lid margin [154]. Instruments that do not allow the assessment of the entire area of the cornea exposed during eye opening may fail to detect areas of tear film abnormality.
The sensitivity and specificity of the NIBUT varies according to the specific technique used, with values of 82–84% sensitivity and 76–94% specificity being reported [134,142,147]. A cut-off value of less than or equal to 10 s has been reported to be indicative of DED when viewing the reflection of an illuminated grid pattern [134]; The absolute values for breakup time have been reported to be longer for non-invasive techniques, with a mean difference of 3.7 s being reported [38]; however, when breakup times are shorter, the differences between the two techniques have been reported to be of lesser magnitude [155].
Evaporation of the tear film results in a cooling of the ocular surface [156], therefore measuring the absolute temperature and the spatial and temporal changes in temperature during the inter-blink period, can be used as an index of tear film stability. Infrared thermography is able to measure the temperature of the ocular surface in a non-invasive manner and provide an objective, quantitative output [157]. Purslow and Wolffsohn demonstrated the ocular surface temperature measured using infrared thermography is principally related to the tear film [158]. The evidence in the literature indicates that the cooling rate of the ocular surface is faster in individuals with DED than in normal eyes, which is assumed to be as a result of a greater rate of tear film evaporation [156,159–161].
Advances in instrumentation have allowed measurement of the ocular surface temperature with increasing accuracy, resolution, and speed [160–163]. Recently, thermography has been used to differentiate between DED of differing aetiologies, with the lowest temperatures and greatest cooling rates being reported for presumed ADDE, and lower rates in dry eyes of presumed evaporative aetiology [164].
Studies have also been conducted in which ocular surface temperature and FBUT have been measured concurrently [165,166]. Su et al., demonstrated that areas of ocular surface cooling and breakup were co-localized [166], and Li et al., reported a direct relationship between FBUT and ocular surface cooling, implying that localized increases in evaporation are contributing to tear film thinning and breakup [165]. Using a customized ocular surface thermography device, a method has been demonstrated in which the exact area showing temperature reduction can be determined by analysing a series of images over a period of 9 s [167]. From this analysis, a “thermal breakup area” and “thermal breakup time” can be reported. Furthermore, the subjective sensation of discomfort has been reported to occur earlier in the interblink period in patients with DED than in controls (during forced eye opening), and that the subjective symptoms were correlated to low corneal temperatures and enhanced tear evaporation [168]. Sensitivity and specificity values of around 80% have been reported [160,161].
An in-depth review of the evidence relating to osmolarity testing in the diagnosis of DED is provided in Section 6.5.1.1; however, it is also important to consider how spatial and temporal variations in tear osmolarity might affect tear film stability. There is greater inter-eye variability of osmolarity in DED than in normals [12,15,169], and the inter-eye differences increase with disease severity [13]. Moreover, this inter-eye variability has been shown to substantially reduce over time with successful treatment of DED [125].
While repeated measurements over a period of time have been shown to be low and stable in normal subjects, DED subjects showed relatively elevated and unstable readings [170]. This finding is termed heteroscedasticity, or increasing variation with increasing value [171]. Keech et al., further reported that the variability of tear osmolarity of normal subjects was indistinguishable from the analytical variability of measurements of a control solution of known osmolarity, suggesting that normal individuals retain an effective tear film with little variation from blink-to-blink and day-to-day [170]. In contrast, the tears of individuals with DED demonstrated increasing variation and the authors speculated that this was due to “a combination of chaotic or incomplete mixing between blinks and spatially variable tear film breakup, leading to a stochastically increased evaporation rate.”
In a small study conducted by Liu et al., a link was reported between hyperosmolarity and tear instability, suggesting that transient increases in tear osmolarity may be observed under conditions of tear instability [172]. More recently, Peng et al., purported that increases in evaporation, that resulted during prolonged interblink periods or as a result of environmental factors (such as increased humidity and wind speed), drive tear film breakup, and predicted “massive” increases in osmolarity at the centre of areas of rupture of the tear film [173].
Indeed variability of osmolarity has been recommended to be a feature that clinicians should specifically be looking for when trying to identify patients with DED [13]. Sullivan advocates that between-eye differences beyond the threshold of 8 mOsm/L should be considered an indication of the loss of tear film homeostasis that occurs with DED [171].
An intact lipid layer may be necessary to prevent tear film evaporation [174]. The tear film evaporation rate is used as an indicator of tear film stability [175]. Evaporation of the tear film has been measured using a number of different techniques including a vapour pressure gradient [176,177], and the velocity of relative humidity increase (resistance hygrometry) within a goggle cup placed over the eye [178–181]. Using these techniques, higher evaporation rates between blinks have been reported to be associated with poor tear film stability [148], and DED symptoms [179,182,183]. An absent, or non-confluent lipid layer has been determined to be associated with a four-fold increase in evaporation rate [148], and a two-fold increase in evaporation rate has been reported in patients with keratoconjunctivits sicca [179]. The rate of evaporation of the tear film has also been shown to be higher in the presence of a contact lens, and the effect remains for a period of 24 h after ceasing contact lens wear [184,185]. Since the evaporation rate is dependent on ambient temperature [186], humidity [175,180,187], and time of day [181,188], and can be affected by evaporation from the skin surrounding the eye, use of tear evaporation rate as a diagnostic and monitoring tool is challenging due to variable measurements.
In an attempt to address these issues, further techniques to measure tear evaporation rate have been proposed [189–191]. Using an infrared thermography camera [192], tear evaporation rate can be measured non-invasively while excluding the influences of the surrounding skin and sealed chambers [189,191]. Rohit et al. have recently described the modification and re-calibration of a dermatology instrument by attaching a swim goggle cup [190]. Using this instrument, the authors reported being able to obtain absolute rather than relative evaporation rates both with, and without, contact lens wear. Despite these developments, a “normal” tear evaporation rate has yet to be established questioning the diagnostic relevance of this measurement at the current time; in addition individual differences in evaporation rate contribute to the challenge.
It should be emphasised that tear film stability test results are highly variable [125]. When performing tests to assess tear film stability, clinicians need to be meticulous about the procedures and factors that may influence the measurements. Thermography and tear evaporation rate evaluation are not well-established clinical techniques. Measurement of the tear breakup time with a non-invasive technique (NIBUT) is considered preferable to the FBUT [193] and the two techniques are well correlated [118,194]. Since there are several different methods for conducting the measurement, standardization is needed for consistency. The measurement should be made before any other invasive tests are conducted (such as eyelid manipulation or staining of the ocular surface). The patient should be instructed to blink naturally three times and then to cease blinking until instructions are given to blink again, and then to blink freely between measurements [66]. Where possible, an automated measurement system is recommended [193], since subjective measurements taken with a videokeratoscope and the Tearscope/Tearscope Plus (Keeler, Windsor, UK) have been shown to vary between measurement sessions and observers [38,195]. A NIBUT cut-off value of less than, or equal to, 10 s has been reported to be indicative of DED in Caucasians, when viewing the reflection of an illuminated grid pattern [134], but the cut-off value with automated measurement systems is generally shorter [141]. The difference might be attributable to the slower response rate of the observer in subjective techniques as well as the objective software detecting interference in the image capture process and interpreting these as breaks in the tear film.
Although not mentioned directly within the definition of DED, the tear film volume is important for ocular surface health and its loss of homeostasis (aqueous deficiency) may be at the same time a key pathogenic mechanism and a diagnostic sign in DED patients, independent of evaporative dry eye.
Meniscometry describes assessment of the tear meniscus and may take the form of a height, or a cross-sectional volume metric. The tear menisci serve as reservoirs, supplying tears to the precorneal tear film [196]. The majority of tear fluid is contained within the menisci [197], formed by the tears lying at the junctions of the bulbar conjunctiva and the margins of both the upper and lower eyelids. The quantitative assessment of the tear menisci is, at present, the most direct approach to study the tear film volume. Slit-lamp techniques to study tear meniscus height (TMH), curvature (TMR), and cross-sectional area (TMA) are widely used in clinical practice and show good diagnostic accuracy and correlations with other DED tests [198,199]. However, this approach is operator-dependent and has important limitations, mainly related to fluorescein instillation and dependence on time-from-blink, which have potential impact on the tear film characteristics. The simplest type of slit-lamp meniscometry, based on judging the meniscus height by comparison to the variable slit-lamp beam height, has shown poor inter-visit repeatability [39]. Specialized meniscometry systems, equipped with a rotatable projection system that includes a target comprising a series of black and white stripes, a half-silvered mirror, and a digital video recorder, have been developed to facilitate simple and dynamic visualization of the tear meniscus, without the need for fluorescein instillation [200–202]. Meniscometry can be influenced by time after a blink, measurement locus along the lid margin, time of day, temperature, humidity, air speed, and illumination [2,66,203].
Application software for the iPod touch (Apple Inc., Cupertino,CA) has been recently developed to create a portable digital meniscometer that generates a grating of parallel black and white bands on the display, and which is reflected from the tear film at a working distance of 50 cm. This new slit-lamp mounted digital meniscometer exhibits good reproducibility, good agreement with both conventional video-meniscometry [204] and optical coherence tomography (OCT) meniscometry [205], and an ability to facilitate detection of tear meniscus changes following the instillation of artificial tears [206].
OCT assessment of the tear meniscus, described as an emerging technology in the TFOS DEWS 2007 report [2], has been extensively studied in the last ten years [207–226]. Upper and lower TMH, TMA, TMR and tear meniscus depth are, at present, the most commonly studied parameters. Spectral-domain OCT meniscometry has shown good intra-observer and inter-observer repeatability [212,219,224], that is superior to time-domain OCT [213,226]. The measurements are instrument-dependent [213,216], and can be biased by conjunctivochalasis, LIPCOF, disorders of lid margin congruity, and apposition between the lid and ocular surface [218,227]. The main advantages of OCT meniscometry are that it is non-invasive and image acquisition is rapid and simple, however analysis of the image may be complex, time-consuming and operator-dependent [224]. The development of validated measurement software is needed, ideally allowing dynamic image analysis to minimize interfering factors related to head, eye and eyelid movements [211,224].
The phenol red thread (PRT) test that received brief mention in TFOS DEWS report [2], and was removed more than 10 years ago from the Japanese DED diagnostic criteria, consists of a thin cotton thread soaked with phenol red, a pH-sensitive dye. When dry, the thread assumes a yellow color, but when moistened by tears the thread turns red as a consequence of the slightly alkaline physiological pH of tears (between pH 7 and 8) [228]. The test is performed by hooking the folded end of the thread, within the temporal one-third of the eyelid, over the eyelid margin for 15 s. The small dimensions of the cotton thread should limit the chance of eliciting substantial reflex tearing [229], and the minimal amount of pH indicator soaked on the thread should minimize the irritating effect of the test, as shown by the repeatability of multiple PRT tests performed during the same session [230]. These elements suggest that the PRT test provides an indirect but realistic measure of the resting tear volume [231,232]. However, some authors have reported no significant correlation between the PRT test and tear volume determined with previously established methods such as TMH measurement or fluorophotometry [230], and poor correlation between PRT test results and DED symptoms [17]. Conflicting data, from weak [46], to strong [233], agreement, have been recently published on the correlation between the PRT test and Schirmer test. In clinical practice, an arbitrary cut-off value of 20 mm has been adopted to differentiate DED with and without aqueous deficiency using the PRT test [234]. A cut-off of 10 mm gives a sensitivity of 25% and specificity of 93% [235]. Doughty et al. reported small and not statistically significant differences between PRT performed with open or closed eyes [236].
The Schirmer test is performed by folding the Schirmer paper strip (5 × 35 mm) at the notch and hooking the folded end over the temporal one-third of the lower lid margin. The score is the measured length of wetting from the notch, after a period of 5 min. The Schirmer test without anesthesia is a well-standardized test, providing an estimation of stimulated reflex tear flow. Although some authors have reported that the Schirmer test with topical anesthesia or nasal stimulation might be more objective and reliable in DED detection [237,238], there is a lack of high level evidence data on repeatability, sensitivity and specificity for these approaches [39]. Administering the test with the patient's eyes closed may minimize the variability of results [239], reducing the influence of the vertical gaze position [240], and horizontal eye movements [241]. Several diagnostic cut-off values have been proposed, from ≤5 mm/5 min [2], to ≤ 10 mm/5 min [228], and a range of sensitivity (77% [88] – 85% [242]) and specificity (70% [88] - 83% [242]) values have been reported. The combination of Schirmer and PRT tests has been proposed to improve the diagnostic accuracy, at least in patients with ADDE [228].
A variation of this test, termed strip meniscometry, involves dipping a strip (made of a 25-mm polyethylene terephthalate covered with a urethane-based material with a 0.4 mm central ditch containing a nitrocellulose membrane filter paper strip impregnated in natural blue dye reservoir) for 5 s into the tear meniscus [243]. Strip meniscometry with a cut-off of ≤4 mm has a sensitivity of 84% and specificity of 58% used in isolation and up to 81% sensitivity and 99% specificity when combined with TBUT [244].
Meniscometry (volume or height) provides a non-invasive method to indirectly assess tear volume for DED sub-classification, with moderate repeatability especially if digital imaging rather than observational techniques are adopted. It is traditional to image the meniscus in the centre of the lower eyelid without lid manipulation shortly after a blink [66]. The Schirmer test without anaesthetic remains a diagnostic test recommended for confirming severe aqueous deficiency (such as in Sjögren syndrome) [245], but its variability and invasiveness, precludes it use as a routine diagnostic test of tear volume, especially in cases with evaporative dry eye secondary to MGD where tear quality rather than quantity is predominantly affected and any subtle reduction in resident tear volume in the interpalpebral space will likely be masked by the reflex tearing response on insertion of the strip.
A recent review of the literature identified 163 articles published since the year 2000 relevant to the use of tear osmolarity in the diagnosis of DED [246]. Hyperosmolarity of the tear film on the ocular surface causes a significant increase in interferon gamma, in the absence of large increases from other Th1, Th2 and Th17 cytokines, which can induce epithelial cell apoptosis through the JAK/STAT signalling pathway to induce cell death [247]. Tear osmolarity has been demonstrated to have the highest correlation to disease severity of clinical DED tests [11], and has been frequently reported as the single best metric to diagnose and classify DED [12,13,246]. However, other studies have indicated current measurement techniques to be highly variable [248]. Osmolarity generally increases with disease severity [174], classified as normal (302.2 ± 8.3 mOsm/L), mild-to-moderate (315.0 ± 11.4 mOsm/L) and severe (336.4 ± 22.3 mOsm/L). More severely affected subjects exhibit both an increased average and increased variability between eyes and between visits [11,170], making the marker heteroscedastic [170]. Various cut-off values for DED have been proposed in the literature, from 305 mOsm/L [249], to 316 mOsm/L [12], with reported sensitivities ranging from 64% to 91% [15,23,249,250], specificities from 78% to 96% [249,251], and positive predictive values ranging from 85% to 98.4% [249,252]. These data support the 316 mOsm/L cut-off as a specific threshold to better differentiate moderate to severe DED, or when used in parallel with other specific tests, while the 308 mOsm/L cut-off has become a widely accepted, more sensitive, threshold for use in routine practice to help diagnose mild to moderate subjects [13,15].
Ferning occurs when the tear film is dried, typically on a glass plate. As the pattern of the tear fern depends on the composition of the tear sample, tear ferning may be a simple test for tear film quality at a gross biochemical level. The process requires a slow crystal growth rate, low solution viscosity and low impurity levels to permit free-solute diffusion. Seven to 10 min under normal room temperature (20–26 °C) and room humidity (RH up to 50%) has been recommended [253]. The crystallisation begins with the formation of a nucleus, due to the supersaturation of ions with solvent evaporation at the peripheral edge of the drop. When the sample solute is able to diffuse into areas with a lower solute concentration, normal crystals can form [253].
Healthy tear samples produce compact, dense ferning patterns, while in dry eye samples, the pattern is fragmented or absent [254]. Electrolytes may play a role in ferning as hyperosmolarity has been found to result in deteriorated ferns [249,255]. It has a high reported sensitivity and specificity in Sjögren's syndrome [256–258]. and rheumatoid-induced keratoconjunctivitis sicca [259], but the results are more variable in DED [249,254]. Tear ferning is correlated with tear film volume and weakly with tear film stability, but seems to be independent of individual tear proteins [260]. Tear ferning changes with contact lens wear have been found to have a moderately high sensitivity (78.4%) and specificity (78.4%) for predicting contact lens tolerance in a clinical setting [261]. However, other studies have found that the tear ferning test had a poor correlation with tear film stability and symptoms in contact lens wearers [262].
Despite some potential diagnostic ability, the underlying mechanisms responsible for producing tear ferning and their interaction with dry eye sub-types are still poorly understood and hence this cannot currently be recommended as a diagnostic test [253].
With respect to osmolarity measurement, recent data have reinforced that two values are important to note in tear testing: the higher value of the two eyes, which is considered more indicative of the DED process, and the difference in value between the two eyes, which provides insight about the instability of the tear film [13]. Using the maximum value between both eyes has been shown to provide a higher dynamic range and larger observable change after effective therapy than using the average or single eye [10,170], and this approach is approved by the FDA for commercially available tests [263]. Normal subjects have little or no diurnal change, with repeat testing at time intervals of 1 min, 15 min, 1 day, and 5 days, demonstrating variation largely indistinguishable from the analytical precision of a commercial instrument (≈± 3–6 mOsm/L) [10,170,264]. Moreover, a longitudinal study showed that tear osmolarity is the least variable of all the common signs for DED over clinically relevant time scales [10], which might seem counterintuitive, since tear osmolarity has the highest frequency of variation, changing blink-to-blink depending on the stability of the tear film and severity of disease, however the actual amplitude of variation is strongly dependent on disease severity. Inter-eye differences of normal, mild to moderate and severe DED patients were 6.9 ± 5.9 mOsm/L, 11.7 ± 10.9 mOsm/L, and 26.5 ± 22.7 mOsm/L, respectively [13]. The low variation of normal subjects contributes to the high specificity of the marker and makes it a good candidate for parallelization and therapeutic monitoring. Accordingly, normal subjects don't display elevated osmolarity, so a value over 308 mOsm/L in either eye or a difference between eyes ≥8 mOsm/L are good indicators of a departure from tear film homeostasis and represent a diseased ocular surface [265].
Punctate staining of the ocular surface is a feature of many ocular diseases and instilled dyes are used extensively in the diagnosis and management of DED. In addition, the distribution of micropunctate staining may provide an etiological clue [266]. The most frequently used dyes are sodium fluorescein, rose bengal, and lissamine green. The clinical appearance of fluorescein staining occurs whenever viable cells experience a compromise to their integrity such as a disruption in superficial cell tight junctions or defective glycocalyx [266,267]. It is suggested that there is some weak background fluorescence of healthy corneal epithelial cells [268]. Rose bengal stains ocular surface epithelial cells that are unprotected by mucin or glycocalyx, as well as dead or degenerated cells [269,270]. However, it stings on instillation and induces reflex tearing. In addition, it has been shown to suppress human corneal epithelial cell viability in vitro [271]. On the other hand, lissamine green is less toxic to the ocular surface and consequently is as well tolerated as fluorescein [272]; it stains epithelial cells only if the cell membrane is damaged (a vital dye), irrespective of the presence of mucin, whereas rose bengal, because of its cytotoxicity, produces staining irrespective of the state of cell health, once mucin is absent [273,274]; therefore lissamine green has largely replaced the use of rose bengal in evaluating ocular surface disorders [13,275]. There have been also several reports using mixtures of these dyes for simultaneous staining of the cornea and conjunctiva [272,276,277]. A solution of 2% fluorescein and 1% lissamine green has been found to be optimal in terms of comfort and staining efficacy, but is not commercially available [272]. Sequential staining and/or using more than one paper strip will increase the likelihood of observing ocular surface damage [277,278]. Fluorescein has a peak excitation wavelength of 495 nm, whereas the commonly used ‘cobalt blue’ light filters of slit lamp biomicroscopes have a peak of around 450 nm [279]. The fluorescence peak is around 515 nm within the pH range of the tear film, so the yellow barrier filter required for optimum observation should band pass at around 500 nm [279]. For lissamine green, a red filter (567–634 nm) to enhance contrast against the sclera may enhance staining visibility [280]. For consistent recording of staining severity of the ocular surface, there are various grading systems including the van Bijsterveld system [242], the National Eye Institute/Industry Workshop guidelines [281], the Collaborative Longitudinal Evaluation of Keratoconus (CLEK) schema [282], the Oxford Scheme [283], the area–density combination index [284], and the Sjögren's International Collaborative Clinical Alliance ocular staining score (Table 3) [285]. Corneal and conjunctival staining have been shown to be informative markers of disease severity in severe DED, however, staining of the ocular surface in mild/moderate DED showed poor correlation with disease severity [11]. Therefore, observing staining of the cornea and conjunctiva is considered an important aspect in the clinical analysis of severe DED.
Impression cytology is a relatively simple and practical technique that has been used in the diagnosis of the ocular surface disorders such as DED, limbal stem-cell deficiency, ocular surface neoplasia, and specific viral infections [287]. During the past decade, it has become standard to study squamous metaplasia and goblet cell density of the conjunctiva for the diagnosis and monitoring of DED [288]. Cells from the first to third most superficial layers of the epithelium are removed by application of cellulose acetate filters or biopore membranes, and the cells can be subsequently analyzed by various methods including microscopy, immunocytochemistry, immunoblotting analysis, polymerase chain reaction, and flow cytometry, depending on the objective of the investigation [289]. Specific examination procedures for impression cytology are described elsewhere [290]. For analyzing conjunctival impression cytology, several squamous metaplasia grading systems based on qualitative or quantitative cytological criteria are applied. The best-known methods include the systems by Nelson [291], Tseng [292], and Blades [293]. Among them, the Nelson classification system, considering the density, morphology, cytoplasmic staining affinity and nucleus/cytoplasm ratio of conjunctival epithelial and goblet cells, remains widely used [294].
Lid-parallel conjunctival folds (LIPCOF) are folds in the lateral, lower quadrant of the bulbar conjunctiva, parallel to the lower lid margin. LIPCOF may represent the first mild stages of conjunctivochalasis and thus share the same aetiology [295], but they display slightly different characteristics clinically. The cross-sectional area of LIPCOF is much smaller than that of conjunctivochalasis [227,296]. LIPCOF [235,297–299] do not occur centrally as does conjunctivochalasis, and appear unrelated to age [297]. While conjunctivochalasis can be induced or increased by forceful blinks or digital pressure towards the lid margin or gaze [300], this does not appear to happen in the case of LIPCOF.
LIPCOF occur behind the temporal and nasal tear meniscus along 2/3 of the total length of the inferior tear meniscus [203], and may cause tear meniscus height measurements to be underestimated [227]. Decreased mucin production is associated with the severity of LIPCOF [298], and LIPCOF are significantly correlated with lid wiper epitheliopathy [235,298]. LIPCOF may be related to completeness of the blink [301], blink speed and tear film viscosity [295].
Patients with increased LIPCOF grades are likely to suffer from DED [297,302–304]. One study, showed that combining nasal LIPCOF and NIBUT using an algorithm appeared to be the most predictive DED test combination [235]. Sensitivity of LIPCOF Sum (nasal + temporal LIPCOF) to discriminate between normal and symptomatic DED patients was reported to be 70%, and specificity was reported to be 91%, for a cut-off value of 2, using a revised LIPCOF grading scale (Table 4), where the LIPCOF score is derived from the number of folds rather than the height of the folds [298,299,302]. Another group evaluated a medium predictive ability of temporal LIPCOF using the Höh et al. fold height-based grading scale [297], and defined the cut-off value as 2, giving a sensitivity of 52% and specificity of 64% [303].
LIPCOF are observed, without fluorescein, on the bulbar conjunctiva in the area perpendicular to the temporal and nasal limbus, above the lower lid (temporal and nasal LIPCOF, respectively), with a slit-lamp microscope using ∼25× magnification (Fig. 2) [298,299,302]. LIPCOF can be classified by different grading scales, such as a recent scale counting the number of folds [235]. Care must be taken to differentiate between parallel, permanent, conjunctival folds (LIPCOF, single folds height ∼0.08 mm) and disrupted micro-folds (height∼0.01 mm) [298,299,302,305–307].
Researchers have also used OCT [308,309] and Scheimpflug photography to observe LIPCOF [297]. Using these instruments, additional criteria such as cross-sectional area of LIPCOF or LIPCOF coverage by the tear meniscus can be evaluated [297,308,309]. Conjunctival shrinkage has been proposed as a diagnostic feature of dry eyes [310],and has been shown to occur more in patients with dry eye symptoms, less stable tears and with ocular surface staining, but not those with MGD [311].
In-vivo confocal microscopy (IVCM) is a non-invasive technique that allows the evaluation of signs of ocular surface damage in DED at a cellular level [312,313], including decreased corneal (apex and lower periphery) [314], and conjunctival epithelial cell density [315–317], conjunctival squamous metaplasia (increased mean individual epithelial cell area, decreased nucleocytoplasmic ratio and goblet cell density) [318], and corneal nerve changes (decreased sub-basal nerve density, increased tortuosity and increased number of bead-like formations) [315,317,319–325]. Laser scanning IVCM allows easy identification of conjunctival goblet cells (although some concerns have been reported with regard to evaluation of the tarsal region [326]), suggesting it may be a valuable tool in assessing and monitoring DED-related ocular surface damage [312,327–330]. The IVCM approach seems less invasive, but as effective as impression cytology [318,331], however it has not yet been widely adopted in clinical practice and its predictive ability in the diagnosis of DED is unknown.
Cochet-Bonnet or non-contact air-jet esthesiometers have been employed to evaluate ocular surface sensitivity. Loss of corneal sensation can give rise to severe corneal epithelial disorders such as neurotrophic keratopathy [332,333]. The palpebral conjunctival sensitivity appears to be more critical than corneal sensitivity when assessing DED [334]. Corneal esthesiometry is weakly correlated to other DED tests, but increases with severity of the disease and has achieved a reported specificity of 96%, but a sensitivity of just 19% [249].
While corneal staining is perhaps a later stage feature of DED, combination staining with fluorescein and lissamine green instilled by a moistened and saturated filter paper strip to highlight corneal and conjunctival/eyelid margin tissue damage, respectively [272,276,277,279], is recommended as the most appropriate diagnostic technique for evaluating ocular surface damage. Ophthalmic stain strips are registered as medical devices rather than pharmaceuticals in some countries and lissamine green is not a licensed product in other countries so it is acknowledged that access to these dyes in a clinical setting can be challenging; however, there have been no reported adverse effects, therefore, the benefits would appear to outweigh any risks.
Inflammation is a recognized component of the pathophysiological mechanism of DED [4] and has been proposed to offer a stable indicator of DED severity [335]. However, inflammation is not specific to DED and can occur in other ocular or systemic disease [336,337]. In autoimmune disease, inflammation occurs in the eye as well as specific sites around the body, for example, the joints in rheumatoid arthritis. Autoimmune serum markers, including SSA and SSB are most often evaluated in Sjögren syndrome. Other relevant autoimmune diseases include systemic lupus erythematosis, mixed connective tissue disease, chronic hepatitis, Stevens Johnson syndrome and chronic graft versus host disease (GVHD). Systemic investigations used to differentially diagnose the cause of inflammation might involve biopsy of salivary glands, flow cytometry of peripheral mononuclear blood cells, radiology or imaging of joints.
The most common clinical sign that is suggestive of ocular surface inflammation is conjunctival redness [338–340]. This is a consistent sign of conjunctival vascular dilatation and reactive change to pathological stimuli. It can occur in any disease with inflammation, not just DED, for example, in response to chemical injury, infective conjunctivitis or allergic conjunctivitis. Ocular redness can be easily detected with a pen torch or standard slit lamp biomicroscopic examination. For the purpose of diagnosis and documentation of treatment effects, more quantitative documentation methods using digital imaging analysis have been developed [341–344].
The matrix metalloproteinases (MMPs) are one of many classes of proteases secreted into the tears in DED [174,345–347]. The level of MMPs reflect the loss of ocular surface barrier function, since MMPs can destroy tight junctions in the ocular surface epithelium. MMPs are produced as inactive proenzymes and can be cleaved to become active enzymes. It is therefore important for an MMP diagnostic test to detect enzyme activity levels and not just total tear protein levels. One development is the availability of a commercial ‘point of care’ diagnostic device (InflammaDry®, Rapid Pathogen Screening, Inc, Sarasota, FL, USA) which assays tear MMP-9 levels in 10 min [348]. In its current form, this assay produces a dichotomous outcome, with levels above 40 ng/ml producing a positive result, and is non-specific to the source of ocular surface inflammation.
The levels of tear cytokines and chemokines are important and reflect the level of epithelial disease. Certain cytokines can highlight a specific disease process, for example, elevation of Th1 and Th17 subclasses of cytokines suggest involvement of particular T lymphocyte differentiation pathways in the disease [349]. Elevation of tear Th2 cytokines, on the other hand, may suggest a more allergic-based disease, although recent evidence suggests various aspects of T cell Th1, Th2 and Th17 exist across aqueous deficient, evaporative and mixed forms of DED, with a propensity towards Th1 type T cell responses as a more global indicator of DED [350]. Since collection of tear fluid is relatively non-invasive compared to biopsies or venipuncture for serum assays, it is an attractive idea to include these as diagnostic tools [174,351].
A recent report on standard operating instructions for the tear assay of tumor necrosis factor alpha, interferon gamma, IL-1 beta and IL-6 has been published [352]. This refers to the collection, storage and repeatability of the tear assay, but with laboratory testing rather than a ‘point of care’ device. The operating instructions could be made even more cost-effective by reducing the need for reagents [353]. However, it has been found that tear IL-10 and IL-1β levels had significant inter-day variations, while epidermal growth factor, fractalkine, IP-10 and vascular endothelial growth factor were consistently higher in the evening compared to the midday measurements [354]. Such issues will affect how readily these tests are adopted in routine clinical practice. Tear chemokines such as CXCL9, -10, -11, and CXCR3 are important in the tear fluid, as they serve as ligands for specific chemokine receptors on immune cells [29,355–357]. The elevation of specific ligands may therefore imply the involvement of the specific lymphocytes in the ocular surface, without actually measuring the presence of these lymphocytes.
The most commonly used ocular surface immune marker is HLA-DR expression, a Class-II MHC antigen, which indicates a loss of the normally immune-suppressed environment of the ocular surface. Epstein has recently published standard operating instructions for impression cytology, for use in clinics and in clinical trials [358]. It was reported that sufficient conjunctival epithelial cells could be harvested for the quantification of HLA-DR using a suitable impression membrane, for example, the commercially available Eyeprim™ membrane (Opia Technology, Paris, France). The precision/repeatability of HLA-DR expression was studied and it was noted that collection, storage and shipment of specimens from distant sites were successful and storage of specimens for up to 30 days (with refrigeration) before processing did not affect results. Since the centralized laboratory was able to track large number of masked samples reliably, the authors suggest that this tool is suitable for use in randomized controlled trials of DED.
Although the authors found increased expression of HLA-DR associated with increased clinical severity of DED [358], a comparison with six other studies showed that the normal levels of HLA-DR expression are very variable (ranging from 5% to 54%), and its correlation with traditional clinical signs of DED is weak [359]. This may suggest that not all DED cases are equally inflammatory, or that the marker is non-specific for DED and indeed can reflect any ocular surface inflammation. Nevertheless. use of impression cytology can be helpful in the documentation of particular immune cells in specific contexts of DED. For example, the quantification of neutrophil involvement in Stevens Johnson syndrome has been published [360]. Other relevant markers of apoptosis include CAM-1, CD14+, CD8+ and CD4+ cells [361,362].
Corneal sub-epithelial and stromal IVCM signs of inflammation have been hypothesized and studied in DED for over 10 years [363,364]. More recently, IVCM has allowed examination to be extended to a number of components of the ocular surface morpho-functional unit [315,365]. Recent literature has shown significant differences between patients with DED and controls, and among different types of DED, for many presumed inflammatory parameters, including corneal dendritic cells (DC), stromal hyper-reflective (activated) cells [317,320,321,366], conjunctival hyper-reflective roundish or ovoidal (inflammatory) cells [316,326,367], and meibomian gland acinar wall and inhomogeneous appearance between ‘slices’ (inflammatory infiltration) [329,368]. Some of these parameters have shown good repeatability and correlate with tear film inflammatory mediators, and other signs of DED [369]. Inflamed ocular surfaces, in immune-mediated diseases and in DED, show not only increased DC density, but also morphological DC changes, which may indicate cell maturation [364,370]. In recent research, IVCM imaging of DCs in DED has been able to predict, as well as monitor, the response to anti-inflammatory drugs [370,371], and to detect sub-clinical ocular surface inflammation [372].
As described, practitioners need to be aware that the ocular inflammation tests mentioned are not specific for DED. For a clinical test to be acceptable, it should be readily performed without excessive demands on technical manpower or time [373]. For this reason, research techniques such as mass spectrometry [374,375], have not been included in this section. The technical challenges involved in assessment of tear protein levels should not be underestimated. Only a very minute amount of tears can be sampled from DED patients, and since the linear range of many analytes is different, differential dilution of the collected tears may be necessary. Some of the tests may be problematic when used in a population without normal reference values. For example, many tear cytokines and even MMPs tend to increase with age [376], and age specific upper limits of the normal values have not been published, thereby potentially limiting the usefulness of the tools as diagnostic devices. However, multiplexed cytokine systems are increasingly becoming available [353]. Currently most practitioners do not include one of these tests for inflammation as a prerequisite for clinical diagnosis of DED. Certain clinical tools have been available for a long time, but the recent availability of a standard commercial platform, such as the ocular redness index within the Oculus Keratograph 5M software suggests that tools for measuring inflammation may now be within reach of many clinicians [340].
With the availability of newer immunosuppressive medications and trials concerning these drugs [377,378] it is logical that inflammation should be assessed. The exact modality used may need to be varied depending on the pathway or target cell upon which the immunosuppressive drug acts, and such diagnostic tools should be used for refining patient selection as well as monitoring after commencement of treatment. Costs of these diagnostic tests should be considered, but these should be calculated from a holistic standpoint. For example, if the tests can assist the channelling of patients to appropriate healthcare services there may be cost savings for reduced referrals.
Anterior eyelid features, such as anterior blepharitis and demodex blepharitis, are differential diagnoses and comorbidities of DED rather than diagnostic criteria and therefore are discussed in Section 9.
A small portion of the marginal conjunctiva of the upper and lower lid acts as a wiping surface to spread the tear film over the ocular surface [379,380]. This contacting surface at the lid margin has been termed the 'lid wiper' [379]. The normal lid wiper is rich in goblet cells [381], and appears to be the most sensitive conjunctival tissue of the ocular surface [382]. Lid wiper staining with dyes such as fluorescein and lissamine green, which occurs principally in DED patients [298,299,379,383,384], has been termed lid wiper epitheliopathy (LWE) or upper lid margin staining [379,385,386]. It has been proposed that LWE is related to increased friction (direct contact between surfaces) throughout blinks [298,379,383,384], although modelling of the tribology suggests that tear film viscosity-induced hydrodynamic forces at the start of each blink are the principal cause [295]. Boundary lubrication may therefore play a key role in reducing dry eye [387]. LWE occurs on the upper and lower lids, but most studies report only upper LWE. Lower LWE in contact lens wearers has been found to be associated with DED symptoms in some studies [388], but not others [298,299].
Korb and colleagues reported that 88% of symptomatic patients had LWE but only 16% of asymptomatic patients presented with LWE [45]. Shiraishi et al. reported a higher prevalence of LWE in younger than older contact lens wearers [389]. The predictive ability of upper LWE is reported to be 48% (sensitivity) and 96% (specificity) in non-lens wearers using a cut-off value of grade 1 (based on the Korb grading scale; Table 5). In their protocols, Korb et al. recommend the use of fluorescein and lissamine green in combination to stain LWE with repeated instillation of lissamine green before the evaluation of LWE [45,278]. However in another study, LWE increased following repeated lid eversion, but not dual instillation [390]. LWE can be observed immediately adjacent to the lid margin of the everted eyelid using a slit lamp biomicroscope and is most commonly classified by combining the extent of its staining, in terms of length in mm, and width relative to the lid margin width [45,235,278,298,302,379,391]. Another grading system has proposed observing the area and staining pattern [392]. A more advanced method may be to use confocal microscopy, where small hyperreflective dots, assumed to highlight inflammation, have been observed in lens wearers wearing high coefficient of friction lenses [384].
Oily substances spread to form a thin layer on the surface of water. Exposure of such an oily layer to adequate light results in the generation of an interferometric fringe pattern from interference from the front and back surface refractive index change reflections (from the interface with the air and the muco-aqueous tear film phase respectively). The superficial oily layer of the tear film is thought to retard evaporation of the tears, and, with the rest of the tear film, provides an optically smooth surface over the cornea [148,175,393]. The lipids produced by the meibomian glands usually distribute dynamically from the inferior to the superior region over the ocular surface and then stabilize shortly thereafter [394].
In conjunction with the surface reflection pattern and dynamics, interferometry can allow the thickness of the lipid layer of the tear film to be estimated [148]. Using slit lamp photometry to measure reflectivity, Olsen first estimated the thickness of the lipid layer of the tear film to be approximately 40 nm [395]. Since this initial analysis, single-wavelength interferometry has been applied to such measurements [396–399]. Guillon et al. developed a clinical interferometer (Tearscope; Keeler, Windsor, UK) that uses broadband illumination to visualize the kinetics of the lipid layer of the tear film, showing that different patterns of interferometric fringe are generated according to the lipid layer thickness [154]. Goto et al. developed an algorithm for quantifying lipid layer thickness from interferometric fringe patterns [398]. The DR-1 system (Kowa, Nagoya, Japan) was also developed as an interferometer for evaluation of the kinetics of the lipid layer of the tear film in both normal subjects and patients with DED (Fig. 3). This system has revealed that lipid layer kinetics are related to the tear film condition or blink pattern [398]. Interferometry is now an established technique for clinical examination that allows visualization of the kinetics of the oily layer of the tear film.
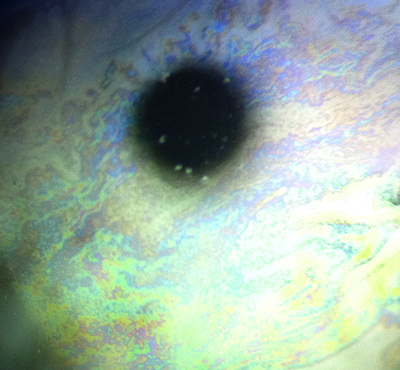
The LipiView interferometer (TearScience, Morrisville, NC) was recently introduced as the first clinically available instrument to allow automated measurement of the thickness of the lipid layer of the tear film [153] This instrument has a sensitivity of 65.8% and a specificity of 63.4% using a cut-off value of 75-nm for the detection of MGD, but its diagnostic contribution to DED has not been established [153]. The lateral shearing interferometer has also recently been introduced for research purposes [400–403]. This latter system relies on illumination with a helium-neon laser, and analysis by fast Fourier transform, to evaluate surface irregularities of the tear film related to breakup of the lipid layer. Such instruments are likely to provide new insights into the lipid layer of the tear film and the pathophysiology of dry eye.
Meibography allows observation of the silhouette of the meibomian gland morphological structure. The original technique involved white-light transillumination of everted eyelids from the skin aspect, with imaging based on black-and-white film [404], infrared film [405–407], and a near-infrared charge-coupled device (CCD) video camera [408]. Arita et al. developed a non-contact, slit lamp mounted meibography system that relies on an infrared filter and an infrared CCD video camera, in which imaging is less time-consuming than other systems (Fig. 4) [409]. Recent advances in technology have led to the development of several mobile, handheld, pen-shaped and multi-functionality systems with infrared light-emitting diodes (LEDs) fixed to infrared cameras that allow the capture of videos and images of similar quality to those obtained with earlier meibography systems [410–412].
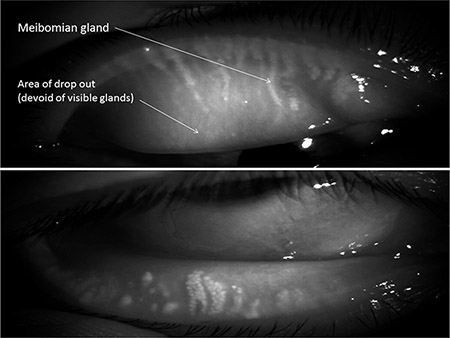
Several different scoring scales, such as the meiboscore, have been proposed for the evaluation of meibography [409,411,413–416]. In addition, quantitative evaluation of meibomian gland area visualized by meibography has been performed [417–420]. Such quantitative evaluation has been applied to the diagnosis of MGD [419] as well as to evaluation of the effects of treatment [421,422]. Meibography alone does not appear to be sufficient for the diagnosis of MGD, but instead should be interpreted in the context of other clinical parameters [411,423–425]. The thickness of the lipid layer of the tear film measured by interferometry (LipiView) was found to be related to meibomian gland area determined by meibography [426]. Tear fluid secretion has also been shown to be positively correlated, as a compensatory mechanism, with the area devoid of meibomian glands in patients with MGD [427].
Diagnostic cut-off values for the meiboscore in combination with symptoms and lid margin abnormalities demonstrated a sensitivity of 84.9% and specificity of 96.7% for the diagnosis of MGD, in a study comparing normal eyes with those affected by obstructive MGD [423]. Meibography scales have been found to be highly reproducible [413,428], Meibography has revealed that changes in meibomian gland morphology are less pronounced in patients with ADDE than EDE [427,429]. However, shortening of meibomian gland ducts was frequently detected in wearers of contact lenses who complained of DED symptoms [430]. Establishing the diagnostic value of meibography in DED requires further study.
Meibomian glands secrete meibum, which contains components of the lipid layer of the tear film. Meibum quantity, quality and expressibility are thought to reflect meibomian gland function. The expressibility of meibum, as an indicator of meibum secretion, is commonly determined by the application of digital pressure to the glands, along the length of the eyelid, through the skin surface of the eyelid [406,431,432], although more standardized procedures for expression have been reported [433]. In the normal eyelid, meibum is clear and readily expressed with gentle pressure. Conversely, the condition of meibum in patients with MGD is varied. In such individuals, meibum can lose its clarity to become cloudy and then opaque and its viscosity can be increased, becoming toothpaste-like and difficult to express in patients with severe MGD. The ranging qualities of meibum as well as its expressibility have been evaluated in various grading schemes. The number and location of expressible glands, as well the response of the glands to different levels of digitally applied pressure, have thus been scored and graded, providing information directly related to meibomian gland condition [416,433–439]. However, the diagnostic value of meibomian gland expressibility and duct appearance has not been established in DED.
IVCM can be used to study the eyelid margin, to diagnose eyelid mite infestation [440,441], and to assess meibomian gland changes [329,442]. This technology has shown diagnostic benefits in obstructive MGD, providing new information about meibomian gland morphology related to specific conditions, such as contact lens wear, GVHD and atopic keratoconjunctivitis [368,443–447], and could detect the response of meibomian glands to treatment [448,449].
Blinking is vital in maintaining optical performance and the health of the ocular surface. The blinking action clears debris, provides mechanical protection and re-forms the tear film [107,393,450–459]. Furthermore, blinking appears to be vital for meibum distribution [460], and in re-forming a proper tear film lipid layer [450,451,454]. The percentage of almost complete blinks is correlated to DED symptoms and LIPCOF, perhaps due to physical interference with spontaneous blinks [298,301], and may be related to MG morphology [461]. However, there is a broad spectrum of reported results, between 10% and 80%, for the percentage of incomplete blinks in a population of healthy individuals [454,455,462–464]. This may be due to the different measurement protocols and procedures, or variations in the visual task, or the eyelid motion detection method.
The normal spontaneous blink rate is reported to occur from 10 to 15 blinks per minute [301,465–467]. It is higher in females than in males [301,463,464], but the effect of age is controversial [301,467,468]. Incomplete blinking can result in DED and exposure keratopathy [301,452,469]. The inter-blink interval is variable between subjects, is decreased in DED and can be increased with artificial tear instillation [301,452,470]. However, the blink rate is also affected by systemic conditions such as Parkinson disease [471], and tasks such as computer work [472].
Blink speed is faster in the closing phase than the opening phase and faster for the upper lid than for the lower lid [473]. There appear to be no correlation between blink speed and either DED symptoms or tear film stability. However the upper lid velocity is positively related to LIPCOF [295,473].
Incomplete blinks can result in DED symptoms and corneal staining observable by slit lamp biomicroscope. Using fluorescein, the incomplete blink can be highlighted by a “tide line” visible as a dark line in the fluorescein pattern indicating the lower limit of movement of the upper eyelid during a recent incomplete blink [464]. More advanced methods utilise high speed video, possible now even on smart phones [474], observed from an inferior-temporal angle [301,475] However appropriate diagnostic cut-off values and sensitivity and specificity figures still require investigation.
Ocular surface sensitivity plays a role in the maintenance of ocular surface homeostasis. A Cochet-Bonnet esthesiometer has been applied to evaluate lid sensitivity in several studies. Norn found that lid sensitivity was intermediate between corneal sensitivity and conjunctival sensitivity in healthy subjects [476,477], and others have reported the lower eyelid is more sensitive than the upper eyelid [478,479]. Lid margin sensitivity was found to be normal in patients with chronic blepharitis or DED [477]. It thus remains unclear whether lid sensitivity may show disease-dependent changes or whether it is unaffected in eyelid disease.
For subtype classifying of DED and to inform appropriate management, the presence of blepharitis, and their blink rate and completeness when a patient is performing a task such as completing a DED questionnaire, unaware that the eye care practitioner is observing them, should be noted. Lipid thickness should be observed with an interferometric technique and the pattern graded. Ideally meibography should be performed along with duct observation and expressibility [480].
From Section 6, the recommended diagnostic and monitoring test battery is collated in Fig. 5. Symptoms and at least one positive result of the markers of homeostasis listed below should constitute the diagnosis of DED. If a patient has dry eye symptoms, DED is diagnosed when at least one homeostasis test result is positive. This can occur even if the practitioner does not have access to the full battery of recommended tests. However, if the practitioner has access to only a limited number of the homestasis marker tests and these show negative results, a referral may be necessary to confirm the results of the remaining measures, to which the practitioner does not have access, before a diagnosis of DED can be excluded.
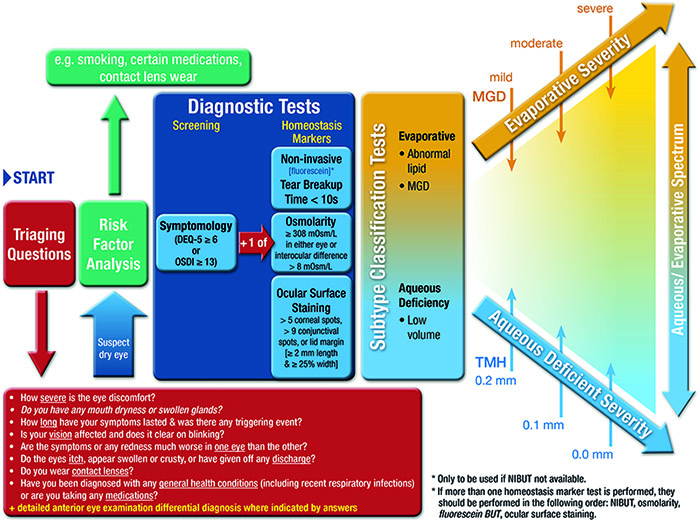
In situations where there are chronic symptoms but limited signs, that are refractory to treatment, then neuropathic pain rather than DED should be considered. Asymptomatic patients with DED type signs, unattributable to other conditions via the differential diagnosis and comorbidities triaging questions in Section 9, might still warrant prophylactic ocular surface treatment. Videos of these diagnostic as well as sub-classification techniques of MGD, lipid thickness/dynamics and tear volume are available on the TFOS website (https://www.theocularsurfacejournal.com).
Tables of severity describing several signs and symptoms and (often arbitrary) cut-offs for different levels are of limited use, as features of dry eye often do not show strong association. Hence it is recommended that severity, for the purpose of selecting treatment, is based on subtype classification features (MGD, lipid thickness/dynamics and non-invasive tear volume) along with symptomology.
The recommended order and clinical practice procedural recommendations are as follows:
DEQ-5 (Fig. 6a) or OSDI (Fig. 6b) – self-administered [35,37]. Positive result is a DEQ-5 score ≥6 [37], or OSDI score ≥13 [35].
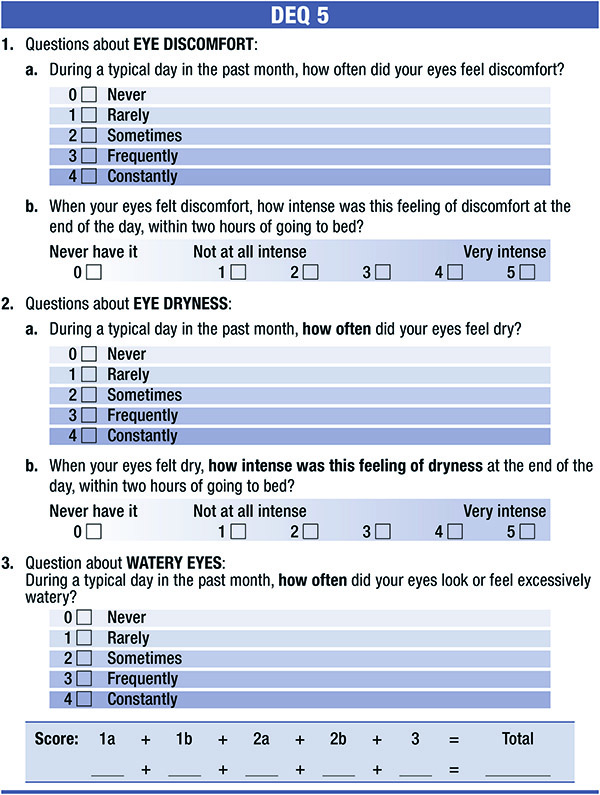
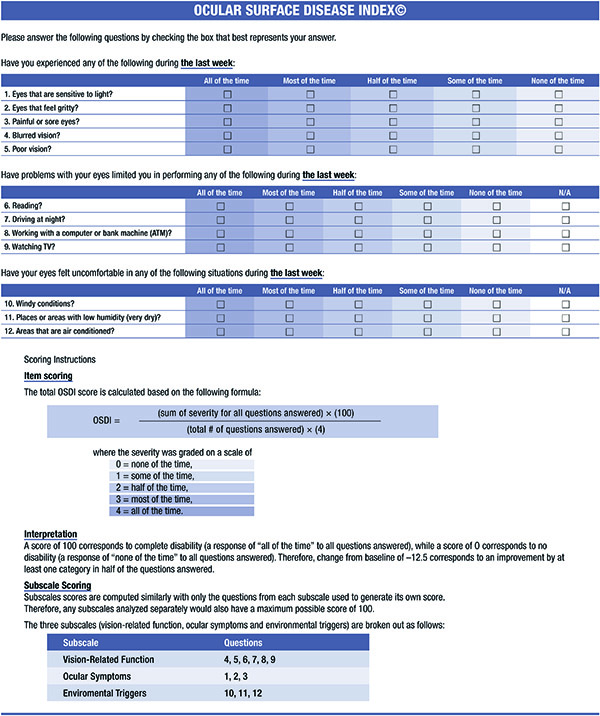
Non-invasive breakup time should be performed with a method where as much of the naturally exposed cornea as possible is specularly illuminated with a light source allowing observation of breakup over the whole surface, after a blink. Objective methods are preferred, with three measurements being performed and the median value recorded. Following training, if a patient can no longer refrain from blinking before the tear film breaks up, this is typically counted as the breakup time for that measurement [194]. The lower median breakup value of the two eyes should be considered in making the diagnosis. The cut-off for a positive finding can be as low as 2.7 s for automated algorithms [142], and up to 10 s for subjective observation techniques [134].
8.2.2 FBUT
FBUT can be considered when non-invasive techniques are not available, but due to its more invasive nature, should follow after osmolarity measurement. Fluorescein should be instilled at the outer canthus to avoid ocular surface damage (see Section 8.4.1 for instillation instructions), with the excess saline on the strip shaken off, or a reduced area fluorescein strip used [118]. For optimal results, viewing should take place between 1 and 3 min after instillation [279]. A positive finding has been reported to be a value < 10 s [13] although in some studies the average in healthy middle aged patients is noted to be lower than this [244].
Osmolarity should be assessed with a temperature stabilised, calibration checked device. In the case of the Tearlab, temperature stability is achieved by having the device powered on for a sufficient period of time with test cards adjacent to the device for at least 30 min. Seat the patient with chin tilted upward and eyes directed toward the ceiling. Place one hand on the face for stabilization, as appropriate. Do not pull the eyelid down or away from the eye. Sample from just above the lower eyelid tear meniscus, being careful not to press inward to avoid contact with the globe during collection. The difference between the eyes as well as the absolute measures can be diagnostic [170,171]. A positive result is considered to be ≥ 308 mOsm/L with the currently available device in either eye [13,15], or an interocular difference >8 mOsm/L [171].
Principally for assessing conjunctival and lid margin damage, a lissamine green strip is wet with saline, with the whole drop retained on the strip for at least 5 s to elute the dye. A 10 μL or ∼ ¼ to ½ of a drop appears to be an optimal volume if pipetting a predetermined concentration solution [272,280]. Otherwise, a drop from the strip is instilled inside the far lower temporal lid in upgaze with the lower eyelid of the eye pulled slightly temporally to avoid damage to the conjunctival or lid wiper tissue (Fig. 7). Studies have suggested that observation should occur between 1 and 4 min post-instillation, and that observation through a red filter potentially aids visualization [272,280]. A positive score is > 9 conjunctival spots [285].
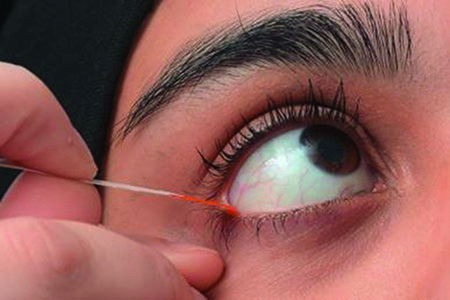
Principally for assessing corneal damage, fluorescein should be instilled in a similar way, but with the excess saline on the strip shaken off to instil a minimal volume. Optimal viewing is between 1 and 3 min after instillation [279]. A positive result is > 5 corneal spots [285].
Lid wiper epitheliopathy can be observed stained with fluorescein, rose bengal or lissamine green dyes, although there seems to be a preference for just lissamine green in recent research, with viewing recommended 3–6 min after repeat instillation using 2 separate strips wet with 2 saline drops [484]. Positive is LWE of ≥ 2 mm in length and/or ≥ 25% sagittal width (excluding Marx's line) [391].
DED severity can change with the time of day so this should be considered in interpreting results and in monitoring DED over time [485,486].
Based on the conditions that can mimic the signs and symptoms of DED outlined in the subsections below, administering a series of questions (Table 6) will aid in the differential diagnosis. While further investigation of possible comorbidities should not negate immediate relief management of DED-type symptoms, failing to fully investigate possible comorbidities can lead to non-optimized treatment and the delayed diagnosis of causative conditions that could have serious consequences, such as the higher risk of malignancy in Sjögren syndrome [487]. If questioning by non-eye care professionals suggests DED, but recommended treatments do not result in a marked improvement in symptoms within about a one-month period, a detailed eye examination is recommended.
For those patients where the history-taking for differential diagnosis suggests that this might not be primary DED, a full differential diagnosis should be performed using a slit lamp biomicroscope to examine the:
• eyelashes for both anterior blepharitis and signs of demodex infestation
• eyelid palpebral conjunctiva for MGD and the presence of follicles or swelling
• bulbar conjunctiva for redness pattern and signs of swelling
• cornea for ulceration, and staining should be applied to detect possible trauma
• anterior chamber for the presence of cells or flare, indicating intraocular inflammation
Symptoms of DED may be very similar to those of allergic conjunctivitis and the conditions can occur simultaneously [380]. In one study of 689 patients with Sjogren Syndrome, clinically significant itching was found in 194 (28.2%) cases; DED was reported to be a symptom in 247 (35.8%) cases; and redness was documented in 194 (28.2%) cases [487]. Systemically, the presence of immunoglobulin E (IgE) antibodies to seasonal or perennial allergens can be documented in most cases of allergic conjunctivitis [488], and there are now some diagnostic tests available to indicate the presence of IgE biomarkers in the tear film or on the ocular surface. In addition, classical allergic conjunctivitis clinical findings, such as conjunctival chemosis, eyelid edema and conjunctival papillae, differentiate allergic from DED [489,490]. Also, allergic rhinitis is present in more than 80% of ocular allergy cases [491,492], but is not a symptom known to be associated with DED. Other findings frequently detected in allergy include a strong family history, atopic dermatitis and/or the presence of asthma [493]. Common oral pharmaceutical agents for allergy treatment have a significant drying effect on the ocular surface and may actually induce DED in patients [494,495]. A diminished tear volume, in turn, permits allergens to remain on the surface longer and may induce or exacerbate allergic conjunctivitis [496].
Giant papillary conjunctivitis (GPC) is associated with trauma to the upper tarsal plate. Contact lens wear is the primary contributor, although an exposed suture following a corneal transplant, a foreign body or ocular prosthesis also could induce GPC [497]. Symptoms of GPC and DED can overlap, including discomfort, decreased contact lens wear time and mucin discharge. The key differentiating findings include large upper tarsal papillae and hyperemia with usually minimal corneal or bulbar conjunctival involvement [497]. Further, in most instances, the cause of the trauma usually is identifiable.
Atopic keratoconjunctivitis (AKC) is a chronic and potentially severe, visually threatening form of allergic eye disease. As AKC is a bilateral, chronic, inflammatory disease, the signs and symptoms may be similar, and DED may actually be present in many of these patients. Additionally, signs of inflammation are noted on the cornea, conjunctiva and eyelids. Common symptoms include photophobia, burning, tearing, itching, mucoid discharge, and eyelid hyperemia and hypertrophy, often with greater lower eyelid involvement. Some of the more common signs that are found in both AKC and DED include SPK, conjunctival injection or hyperemia, blepharitis/MGD and tear dysfunction [498–501]. The OSD in AKC patients is characterized by greater epithelial damage and SPK [502]. Prolonged inflammation plays an important role in the progression of OSD in patients with longstanding, active AKC [415]. The hallmark findings of AKC that may help differentiate it from DED include conjunctivitis (potentially cicatrizing), periorbital eczema [503], corneal neovascularization that could lead to eventual conjunctivalization of the cornea, symblepharon, keratoconus and anterior polar cataracts [504,505]. Other key findings that may aid in the differential diagnosis include a strong family history of multiple allergies, atopic dermatitis, the presence of asthma and periorbital eczema [506]. In fact, it is estimated that atopic dermatitis and asthma are present in 95% and 87% of AKC patients, respectively [497].
Vernal keratoconjunctivitis (VKC) causes rapid fluorescein breakup time, SPK associated with sodium fluorescein staining and increased conjunctival lissamine green staining [507]. Patients with VKC often report severe symptoms, including intense itching, burning, epiphora, conjunctival injection and photophobia [508,509]. Clinically, VKC is associated with the presence of large cobblestone papillae and/or Horner-Trantas dots [510]. The condition can lead to debilitating corneal damage, including shield ulcers and scarring. Another key differentiator from DED is that this condition tends to occur in younger male patients—most notably those under age 18 [511].
Viral conjunctivitis is a relatively common presentation that affects patients of all ages, including the ages during which DED is most frequent. The majority of viral conjunctivitis cases involve the highly contagious adenovirus (65–90%) [512]. Adenovirus is capable of surviving for long periods on environmental surfaces and takes a long time to shed, giving it an incubation period of 4–10 days before it is clinically observable [513]. In addition to the two types of adenovirus; pharyngoconjunctival fever (PCF) and epidemic keratoconjunctivitis (EKC), other viral conjunctivitis causes include herpes viruses, picornaviruses, and several systemic viral infections.
Although viral conjunctivitis has a number of findings in common with DED, such as tearing, burning, redness, irritation, photophobia and blurred vision, a number of differentiating factors also exist. Patients with viral conjunctivitis usually experience redness and irritation in one eye initially, often spreading to the fellow eye within a few days. When asked, patients also often report recent upper respiratory tract infection or close contact with someone with a red eye. Morning crusting is also common. Exam findings usually reveal a watery, mucoid discharge and red, edematous lids. Preauricular lymphadenopathy is also commonly present [514].
The term EKC is used when adenoviral eye infections invade the cornea. EKC, in particular, tends to be accompanied by periorbital edema and significant inflammation that may also involve the extraocular muscles. A follicular response is often noted on the palpebral conjunctiva. Early stage EKC presents with positive pre-auricular lymphadenopathy on the ipsilateral side to the eye that first manifested the conjunctivitis. Approximately one week later, the cornea typically exhibits sub-epithelial infiltrates, which account for symptoms of irritation and pain, often leading to decreased visual acuity that can last months or even years after the infection subsides [513].
PCF is a highly infectious illness with systemic symptoms including sweats, sore throat, fever and headache. Myalgia, malaise, pharyngitis, and gastrointestinal disturbances also are typical in patients with PCF. Upper respiratory tract symptoms may precede ocular findings, but not in all cases. Acute follicular conjunctivitis and regional lymphoid hyperplasia with tender, enlarged preauricular lymph nodes are often also found in patients with PCF. PCF is most commonly observed in children and in groups living in close quarters, such as schools, prisons, ships, military bases and families. It is self-limiting and often dissipates within a week [514].
Herpes viruses that cause conjunctivitis include the herpes simplex virus, varicella-zoster virus, which also causes chickenpox and shingles, and Epstein-Barr virus, which also causes infectious mononucleosis. Herpes simplex virus in its primary form typically affects children and presents as a unilateral red eye. It is sometimes accompanied by a vesicular rash around the eyelid area. In the absence of ulceration or vesicles, herpes infection can be more difficult to diagnose. Secondary herpes simplex virus forms typically involve some form of keratitis in addition to the conjunctivitis. Interestingly, research suggests that dry eye is a stressor that may contribute to stromal keratitis in patients who have herpes simplex [515]. Herpes zoster conjunctivitis is also unilateral and typically is accompanied by a rash that involves pustules, vesicles and edema/hyperemia of the surrounding skin, respecting the midline. Conjunctivitis sometimes precedes the appearance of lesions, making diagnosis more challenging in patients with this inflammatory condition [516].
The Epstein-Barr virus infects >90% of the population [517]. Initial exposure generally occurs during infancy or early childhood and produces subclinical infection. However, if exposure occurs in adolescence, it often manifests as infectious mononucleosis. Epstein-Barr virus infection of ocular structures most often results in transient follicular conjunctivitis [518] but can also manifest as DED, keratitis, uveitis, choroiditis, retinitis, oculoglandular syndrome, papillitis, and ophthalmoplegia [519]. Picornaviruses, such as enterovirus 70 and coxsackievirus A24, are highly contagious and often are the cause of epidemics. Like adenoviral conjunctivitis, picornaviruses cause an acute hemorrhagic response, although the clinical appearance is usually more severe. A number of systemic viruses—including as rubeola (measles), rubella (German measles), mumps, and influenza also frequently involve conjunctival infection [514]. In cases where clarification is desired, diagnostic tests with high sensitivity and specificity can help identify forms of viral conjunctivitis in minutes [520].
Acute bacterial conjunctivitis is less common than viral and allergic conjunctivitis, but also shares several findings in common with DED. Bacterial conjunctivitis can affect patients of any age, but is most commonly found in children [521]. In adults, the more common culprits are gram-positive organisms such as staphylococcus, while in children bacterial conjunctivitis tends to be caused by Haemophilus influenzae and streptococcus species, with more than one causative organism in some cases [521]. As with DED, patients who have bacterial conjunctivitis may complain of irritation, foreign body sensation, burning, stinging and photophobia. However, they are often most concerned with the redness and discharge. Symptoms of bacterial conjunctivitis usually include a greater degree of conjunctival injection compared to conjunctivitis caused by viruses or DED. Also the discharge is wet and mucopurulent, rather than dry and crusty, and patients often complain of matting or adherence of the eyelids, especially in the morning. Bacterial conjunctivitis can be can be unilateral or bilateral and can sometimes be accompanied by systemic findings, especially in children. Systemic symptoms might include fever, malaise, purulent rhinorrhea and a respiratory infection. Otitis media is also common in children and is highly indicative of H. influenzae infection [522]. In some cases, bacterial conjunctivitis is accompanied by a red sheen around the eyelids, which is indicative of preseptal cellulitis.
Inflammation of the eyelids can result from infection by, or allergic reaction to, external agents. The clinical features of blepharitis include redness, exanthema, sores, eschar, swelling, and bullous formation. Blepharitis is classified according to its anatomic location. Anterior blepharitis affects the base of the eyelashes, eyelash follicles, and/or eyelid skin. Inflammation of follicles is categorized as marginal blepharitis, whereas that of eyelid skin is blepharo-dermatitis. The pathogenesis of anterior blepharitis is infectious or noninfectious in nature, and so the location and cause of the condition should be considered for diagnosis [523]. Clinical features of anterior blepharitis often overlap those of DED [524]. Recurrent or persistent blepharitis can cause DED, thus observation of the eyelid is important for adequate diagnosis of DED. The tear meniscus, tear film breakup time and pattern, foamy discharge and debris in the tear film should be observed [524], along with the eyelid position (i.e., ectropion and entropion), eyelid closure (i.e., lagophthalmos), blink response and the anterior eyelid margin (noting any collarettes around eyelashes). Staphylococcal or seborrheic anterior blepharitis are linked to ADDE [482,524] in 50–75% of cases [525,526], perhaps due to the decreased tear volume supporting less lysozyme or immunoglobulins [526]. Definitive diagnosis is made by identification of the responsible microorganism or allergen. There are no specific clinical diagnostic tests for blepharitis. However, cultures of the eyelid margins may be indicated for patients who have recurrent anterior blepharitis with severe inflammation as well as for patients who are not responding to therapy [524].
Demodex mites are common elongated microscopic ectoparasites that live on the surface of the human body. Demodex infestation is related to age with 84% of the population at age 60 and 100% of those older than 70 years exhibiting Demodex infestation [527]. Demodex can spread from the face to the eyelids, perhaps leading to blepharitis and also rosacea [527–530], which may be the link between DED and meibomian gland dysfunction [528,531–533]. However Demodex infestation can also be found in asymptomatic patients [529]. Contact lens wearers do not show higher rates of Demodex infestation than non-wearers, but the relationship with DED symptoms and signs has not been investigated [534]. Two species, Demodex folliculorum and Demodex brevis have been identified in human eyelids [529,535,536]. Demodex folliculorum are typically found in the lash follicles of the eyelids, whereas Demodex brevis burrow deep into sebaceous and meibomian glands. Sebum is thought to be their main food source and Demodex mites may consume follicular and glandular epithelial cells, which may lead to direct damage of the lid margin [529]. Demodex mites can cause blepharitis by carrying bacteria on their surface including streptococci and staphylococci [529,537]. Also the protein inside the Demodex mites and their waste products may trigger inflammatory responses, likely via a delayed hypersensitivity or an innate immune response [538]. Demodex-based lid margin inflammation may result in blepharoconjunctivitis [529]. Proper treatment of ocular demodicosis may resolve blepharoconjunctivitis in adults [529,539], however its role in children remains unclear [529]. Severe cases of demodex with inflamed lid margins can affect the cornea [529,540].
Demodex can sometimes be observed in situ with high magnification slit lamp microscopy, on epilated lashes using standard light microscopy or using more advanced techniques, such as IVCM [329,440,528,529,541]. Liu et al. [529] recommend the following clinical procedure based on a comprehensive literature review:
1. Clinical history: high index of suspicion when blepharitis, conjunctivitis or keratitis in adult patients or blepharoconjunctivitis or recurrent chalazia in young patients are refractory to conventional treatments, or when there is madarosis or recurrent trichiasis.
2. Slit-lamp examination: typical cylindrical dandruff at the root of eyelashes.
3. Microscopic confirmation: detection and counting of Demodex eggs, lavae and adult mites on epilated lashes.
To avoid epilating eyelashes it has also been reported that Demodex leave the follicle and are visible by slit lamp microscopy after gentle tension is applied to the lash and the lash manually rotated with forceps, encouraging exodus of the mites and allowing the lash to “scrape out” Demodex deep within the follicle [542]. As Demodex infestation can also occur in non-DED patients [527], its diagnostic contribution is limited.
Chlamydia is an obligate intracellular parasite and one of the most common sexually transmitted infections [543]. Trachoma (or granular conjunctivitis) is caused by chlamydia trachomatis which results in inflammation, corneal inflammation and scarring of the conjunctiva, obliterating the meibomian gland ductules and goblet cells, and inducing DED complications [544]. A genital infection with chalmydia trachomatis is also the main predisposing factor for adult inclusion conjunctivitis, which is most common in young adults who are usually asymptomatic. The key differential signs from typical DED include the generally unilateral infectious nature, which can be accompanied by corneal ulcers, subepithelial infiltrates or opacity, superior epithelial keratitis, superior pannus, conjunctival scarring, mucopurlent discharge and follicles.
The corneal epithelial barrier can be compromised in the setting of DED, and manifest clinically as punctate epithelial keratopathy/erosions by fluorescein staining, most prominently in the inter-palpebral zone. Other epithelial changes in DED can include filaments, epithelial ridges and, in late stages, keratinization. The epithelial barrier integrity, however, can be compromised due to other non-DED etiologies, which can also lead to epithelial changes and corneal fluorescein staining (Table 7). These conditions often co-exist with DED and may contribute to the OSD. It can sometimes be challenging to determine whether the main underlying reason for the epithelial disease is DED, another etiology, or both.
Certain clinical features help to distinguish these other epithelial abnormalities from those that are directly related to the loss of tear film homeostasis. The history is sometimes helpful; particularly, patients who might have a history of contact lens wear [545], use of multiple eye drops or exposure to toxic chemical agents [495,546]. More importantly, the clinical examination often provides additional information to alert the clinician. Specifically, the pattern and location of the epithelial changes (particularly fluorescein staining) can provide critical diagnostic clues that help distinguish DED from other alternative (or concomitant) conditions affecting the corneal epithelium. For instance, fluorescein staining in a “whorl” pattern can be seen in the setting of epithelial stress (such as toxicity from medications) [495] or conjunctivalization of the cornea due to limbal stem cell deficiency [545,547]. Likewise, fluorescein staining in the superior cornea, which is not typical for DED, may be seen in conditions such as superior limbic keratoconjunctivitis [548], floppy eyelid syndrome [549], and contact lens wear [545].
Conjunctival disease may be another co-morbid condition in patients with DED. One important disorder that can symptomatically mimic DED, and often co-exist and contribute to the patient's tear film instability, is conjunctivochalasis [550,551]. In addition to the clinical findings, the lack of response to standard DED therapies further raises the suspicion and the need to address this co-existing condition. Other critical signs of co-existing conjunctival disease are cicatricial changes (sub-epithelial scarring, fornix foreshortening, cicatricial entropion/trichiasis, and in later stages symblepharon and keratinization) [380,552]. These findings may be a manifestation of underlying systemic diseases such as mucous membrane pemphigoid (also known as ocular cicatricial pemphigoid) and chronic Stevens-Johnson syndrome [552–554]. While these conditions universally have dry eyes as part of the clinical picture, an early diagnosis is critical, as the management often requires more advanced therapies including systemic immunomodulatory therapy.
Filamentary keratitis is generally a chronic corneal condition, characterized by fine strands of degenerated epithelial cells and mucus attached to the cornea at one or both ends [555]. Patients often experience foreign body sensation, grittiness, discomfort, photophobia, blepharospasm, and increased blinking. ADDE is the most common ocular condition associated with filamentary keratitis and best-practice management involves treating the underlying DED and potential mechanical removal of the corneal filaments [556]. Interstitial keratitis is any non-ulcerating inflammation of the corneal stroma, often with vascularisation, but without involvement of either the epithelium or endothelium. The underlying causes are generally infectious or immune-mediated [557]. Neurotrophic keratitis from dysfunction of the ophthalmic division of the trigeminal nerve caused by conditions such as diabetes mellitus, ocular herpes simplex, neoplasia, and ophthalmic surgery is associated with reduced aqueous production [558]. However, treatment after the early stages of the disease can require more radical treatment than primary DED such as antibiotics, antivirals, autologous serum and steroids [559]. Bullous keratopathy is a pathological condition in which small vesicles, or bullae, form in the cornea due to endothelial dysfunction. These blister-like formations can undergo painful ruptures and disrupt vision. Treatments include hyperosmotic eye drops to reduce swelling (5% sodium chloride), amniotic membranes, bandage contact lenses to reduce discomfort, antiglaucoma medications to reduce the flow of fluid into the cornea, and corneal transplantation to replace the damaged tissue [560]. Hence while filamentary and other keratitis, and keratopathies can mimic some of the signs of DED, slit lamp detection of vascularisation, anterior chamber cells and flare, and stromal edema generally set them apart from primary DED.
Eye involvement is common in patients with systemic autoimmune diseases, particularly rheumatoid arthritis, Sjögren syndrome, seronegative spondyloarthropathy, and antineutrophil cytoplasmic antibody-associated vasculitis. The eye is a privileged immune site, but commensal bacteria are found on the ocular surface. Eye injury may be inflammatory, vascular or infectious, as well as iatrogenic, but DED can also be a presenting symptom. Over half of newly presenting DED cases to a tertiary centre were secondary to a known (48%) or undiagnosed (5%) inflammatory disease, primary thyroid disorder, Sjögren syndrome or rheumatoid arthritis [561]. Sjögren syndrome is considered a sub-classification of DED [380], but requires specific diagnostic differentiation from other forms of DED to facilitate appropriate interdisciplinary treatment and allow monitoring of potentially life-threatening complications. Unfortunately the average time to diagnose primary Sjögren syndrome from symptom onset is 6.5 years [562], despite being an independent risk factor for non-Hodgkin lymphoma [563], and the most highly associated risk factor among all rheumatic diseases for malignancy [487]. The revised international classification criteria for Sjögren syndrome, by the American-European Consensus Group Criteria, 2002 [245,564] includes one criterion of daily feeling of dry mouth for more than 3 months, recurrent or persistent swollen salivary glands as an adult, or a need to drink liquids to aid swallowing dry food, thus any of these symptoms in a patient reporting DED should instigate a referral. There are also now serological biomarker tests for Sjögren syndrome [565]. It should be noted that tests not recommended for the diagnosis of DED, such as the Schirmer test, are still recommended for the diagnosis of Sjögren syndrome [245].
Lid related disease such as chalazion or infectious hordeolum, may result in DED symptoms. Other eyelid conditions such as anterior blepharitis and MGD can inform the management of DED and therefore the eyelid should always be carefully observed when DED is investigated.
General symptoms of visual discomfort may include those linked to DED [566]. DED is the predominant cause of computer vision syndrome [567], resulting in the reporting of general visual symptoms after prolonged use of digital screens compared to equivalent paper copy tasks [568]. Incomplete blinks rather than a reduction in blink rate appears to be associated with these symptoms [569]. Differentiation from primary DED is on the basis of history informed triggers of dryness and more general symptoms such as the eyes being tired, hurting, feeling heavy, burning, straining, stinging and experiencing photophobia [91].
GVHD is an immune-mediated inflammatory disease that occurs following allogeneic hematological stem cell transplantation and causes destruction of host tissues by immunocompetent cells from the donor. Typical ocular complications in the acute form of the condition are pseudomembranous conjunctivitis and acute hemorrhagic conjunctivitis in 12–17% of cases [570,571], whereas 60–90% with the chronic form develop ocular symptoms of DED [572], perhaps due to tear fluid levels of receptor agonist IL-8/CXCL8 and interferon inducible protein IP-10/CXCL10 [28]. Ocular symptoms can be minimised by a stepwise approach to treatment involving topical anti-inflammatory medications and autologous serum tears, but patients must be monitored closely, as they are prone to serious ocular complications such as corneal perforation and endophthalmitis [573].
Contact lenses can induce dry eyes (termed CLIDE) and appropriate management strategies should be employed to minimize these [495,574]. This should be distinguished from people who have diagnosed primary DED and wish to wear contact lenses where, as well as the selection of lens modality and material, non-preserved DED treatments should be considered [377].
Concomitant psychosocial issues have been associated with DED. Patients with DED have been shown to have increased prevalence of sleep and mood disorders [575]. Anxiety and depression have also been reported with increased frequency in DED patients in a variety of studies [576–578]. In one population-based cross-sectional study, of over 6000 women, these findings were similarly confirmed. Subjects with a diagnosis of DED were more likely to experience severe psychological stress [odds ratio (OR) 2.5], depressive mood [OR 1.5], and anxiety [OR 1.5] [579]. In another large series of over 7000 DED patients, the adjusted OR of DED and anxiety was 2.8 and DED and the OR for depression was 2.9 [580]. Beyond depression and anxiety, it has been suggested that DED can lead to neuropathic ocular pain and this has been shown to occur with greater frequency in patients who also have comorbid chronic pain syndromes [333,581]. Post-traumatic stress disorder has also been associated with DED and may have a link via treatment medication use or the underlying disease process [61,582]. Neuropathic pain can be differentiated from a disease mechanism through the use of anaesthetic [583], although this has not been reported in relation to DED symptoms.
Specialized forms of DED, such as Sjögren syndrome, has been associated with cognitive and mood disorders [584]. Signs of these disorders signify central nervous system involvement, which is an emerging area within Sjögren syndrome understanding. Other studies have noted that patients with Sjögren syndrome self-report greater fatigue and depression, however when compared to matched controls showed no greater dysfunction on objective tests of cognition and psychomotor function [585]. Hence, a patient's perception of disease and function can be powerful. Health-related quality of life has been studied in Sjögren syndrome, showing that these patients often worry about the consequences of their illness [586].
Table 1 back to top
Clinical differences to detect and resulting sample size calculation based on 2-sample t-test comparison with 80% power and p < 0.05 significance level http://www.statisticalsolutions.net/pssTtest_calc.php. Note that in more complex experiments, such as those requiring repeated measures analysis of variance (ANOVA), it is better to consider the number of degrees of freedom (based on both the number of treatments/visits and the number of replicates), with at least 15 recommended (such as 5 subjects being followed up 4 times during treatment [33]. As dry eye metrics often deviate from a normal distribution, it is recommended that the subject numbers are increased by 10% to compensate [34].
Test |
SD of repeated measures |
Healthy population mean |
Clinical difference to detect |
Minimum sample size per group |
|
OSDI |
6.7 on 100 point scale [35] |
9.6 ± 12.2 [35] |
MCID 4.5 to 7.3 mild/moderate & 7.3 to 13.4 severe disease [24] |
14-35 mild-moderate; |
|
DEQ-5 |
Unknown |
2.7 ± 3.2 [37] |
6 (based on variation between severity classifications) [37] |
Not possible |
|
NIBUT |
7.2 [38] |
11.2 ± 6.8 [38] |
5 s |
33 Tearscope |
|
FBUT |
2.9 average of 2 repeats [39] |
7.6 ± 10.4 [38] |
5 s |
6 |
|
Lipid quality (Tearscope) |
Unknown |
|
|
Not possible |
|
TMH |
0.15 (slit lamp) [39] |
0.29 ± 0.13 mm (slit lamp) [39] |
0.1 mm |
36 slit lamp |
|
Bulbar redness (Efron) |
0.4 [43] |
No reported means- clinically normal taken as grade 0-1 |
0.5 grading |
6–16 |
|
Staining grading (Efron) |
Only weighted k/ICC [39] |
No reported means- clinically normal taken as grade 0-1 |
Not reported |
Not possible |
|
LWE |
No repeatability studies |
Grade 1 |
Not reported |
Not possible |
|
LIPCOF |
No repeatability studies |
Grade 1 |
Not reported |
Not possible |
|
Schirmer Test (without anesthetic) |
3.9 [39] |
16.8 [46] |
5 mm |
5–41 |
|
Phenol Red Thread test |
7.5 [39] |
29.0 [46] |
5 mm |
18–32 |
|
Osmolarity (Tearlab) |
4.8 [47] |
301mOsm/L [15] |
5mOsm/L |
15 |
Footnotes: OSDI = Ocular Surface Disease Index; DEQ-5 = Dry Eye Questionnaire – 5 item; NIBUT = non-invasive breakup time; FBUT = fluorescein breakup time; TMH = tear meniscus height; LIPCOF = Lid Parallel Conjunctival Folds; LWE = Lid Wiper Epitheliopathy.
Table 2 back to top
Features of a range of Dry Eye Questionnaires & supporting literature. Clinical utility of these questionnaires is summarised on Table 6 of the Epidemiology subcommittee report of TFOS DEWS II [57].
Name |
Primary & Recent References |
Dry Eye Screening Criteria |
Type of Validation |
Other Comments |
|
Dry Eye Questionnaire (DEQ) |
Primary: Begley et al. (2002) [58] |
None |
Discriminant focus |
Indiana University |
|
|
||||
|
5-Item Dry Eye Questionnaire (DEQ-5) |
Primary: Chalmers et al. (2010) [37] |
≥6 KCS |
Discriminant focus |
Indiana University |
|
|
||||
|
Dry Eye-Related Quality-of- Life Score (DEQS) |
Primary: Sakane et al. (2013) [62] |
None |
Content |
Frequency & Degree |
|
|
||||
|
Impact of Dry Eye on Everyday Life (IDEEL) |
Primary: Abetz et al. (2011) [63] |
Mild 40–50 |
Content |
Alcon Research, Ltd., |
|
|
||||
|
McMonnies' Questionnaire (MQ) |
Primary: McMonnies & Ho (1987) [64] |
>14.5 |
Chinese Translation & Validation |
Frequency only |
|
|
||||
|
Ocular Comfort Index (OCI and OCI-C) |
Primary: Johnson & Murphy (2007) [66] |
|
Rasch scaled items |
Frequency & Intensity |
|
|
||||
|
Ocular Surface Disease Index (OSDI) |
Primary: Schiffman et al. (2000) [35] |
Mild 13–22 |
Concurrent with SANDE |
Allergan, Inc. |
|
|
||||
|
Symptom Assessment in Dry Eye (SANDE) |
Primary: Schaumberg et al. (2007) [75] |
|
Concurrent with OSDI |
Frequency & Intensity Visual Analogue Scale |
|
|
||||
|
Standard Patient Evaluation of Eye Dryness (SPEED) |
Primary: Blackie et al. (2009) [77] |
|
Concurrent with OSDI |
Frequency & Intensity |
|
|
||||
|
Developed for Use with Contact Lens Wearers |
||||
|
Contact Lens Dry Eye Questionnaire |
Primary: Begley et al. (2001) [78] |
Yes |
|
Frequency & Intensity |
|
|
||||
|
8-Item Contact Lens Dry Eye Questionnaire (CLDEQ-8) |
Primary: Chalmers et al. (2012) [80] |
≥12 = CLD |
Discriminant |
Frequency & Intensity |
|
|
||||
|
Contact Lens Impact on Quality of Life (CLIQ) |
Primary: Pesudovs et al. (2006) [82] |
Yes |
Rasch scaling |
Frequency of bundled symptoms |
Footnotes: Abbreviations in alphabetical order: ADDE = Aqueous Deficient Dry Eye, CLD = Contact Lens Discomfort, MGD = Meibomian Gland Dysfunction, QoL = Quality of Life. CID = clinically important difference, GVHD = Graft Versus Host Disease, NEI-VFQ = National Eye Institute - Visual Function Questionnaire.
Table 3 back to top
Grading scales for ocular surface staining.
Scale |
Cornea |
Conjunctiva |
Features |
|
van Bijsterveld system [242] |
1: few separated spots |
Nasal and temporal zones: |
Focus of Sjögren syndrome |
|
National Eye Institute/Industry Workshop guidelines [281] |
divided into five sectors (central, superior, inferior, nasal and temporal), each scored 0–3 |
divided into superior paralimbal, inferior paralimbal & peripheral area both nasally & temporally, each scored 0–3 |
Total 15 corneal and 9 conjunctival |
|
Collaborative Longitudinal Evaluation of Keratoconus (CLEK) schema [282] |
divided into five sectors (central, superior, inferior, nasal and temporal), each scored 0–4 in 0.5 steps |
divided into four sectors (superior, inferior, nasal and temporal), each scored 0–4 in 0.5 steps |
Fluorescein ICC = 0.76 |
|
|
|||
|
area–density combination index [284] |
area (A0: no punctate staining; A1: >1/3; A2: 1/3 to 2/3; A3 >2/3) & density (D0: no punctate staining; D1: sparse; D2: moderate; D3: high with lesion overlap). |
NA |
combined in single index e.g. A2D3 |
|
Oxford staining score [283] |
Fluorescein, lissamine or rose bengal can be used; 0 to V grade dependent on intensity of punctate staining displayed pictorially across a combination of the cornea and conjunctiva. |
Dots increase on a log scale between grades |
|
|
ocular staining score [285] |
Fluorescein |
Lissamine green |
Fluorescein extra points +1 for confluent patches, staining within pupil or filaments |
ICC, intra-class correlation.
Table 4 back to top
Example of a LIPCOF grading scale [235].
|
|
Grade |
|
No conjunctival folds |
0 |
|
One permanent and clear parallel fold |
1 |
|
Two permanent and clear parallel folds, (normally <0.2 mm) |
2 |
|
More than two permanent and clear parallel folds, (normally 0.2 mm) |
3 |
Table 5 back to top
LWE grading scale [391].
Horizontal length of staining |
Grade |
Sagittal width of staining |
Grade |
|
<2 mm |
0 |
<25% of the lid wiper |
0 |
|
2-4 mm |
1 |
25% - <50% of the lid wiper |
1 |
|
5-9 mm |
2 |
50% - <75% of the lid wiper |
2 |
|
>10 mm |
3 |
≥75% of the lid wiper |
3 |
Table 6 back to top
Initial questions for the differential diagnosis of DED, indicating where more detailed observation of the ocular surface and adnexa is warranted. Medications which can cause DED are noted in the TFOS DEWS II Epidemiology report [57]. Sjögren syndrome is a subtype of DED, but is included in the differential diagnosis questioning to ensure it is considered from the outset.
Table 7 back to top
Common causes of corneal epithelial abnormalities.
Epithelial Trauma |
lid margin keratinization, trichiasis/entropion, foreign body, superior limbic keratoconjunctivitis, floppy eyelid, contact lens wear (including hypoxia) |
|
Epithelial Toxicity |
preservatives from topical medications; such as glaucoma drops, vidarabine; mitomycin-C; fluorouracil (5-FU); other chemical/environmental exposure |
|
Limbal Stem Cell Disease |
autoimmune diseases (Stevens-Johnson syndrome, mucous membrane pemphigoid), contact lens wear, chemical injury, aniridia, ectodermal dysplasia |
|
Epithelial Dystrophies |
epithelial basement membrane dystrophy. Meesman's dystrophy |
|
Conjunctival Scarring |
mucous membrane pemphigoid, chronic Stevens-Johnson syndrome, chronic atopic keratoconjunctivitis |